Ethereum Price Technical Analysis – ETH/USD Downsides Intact
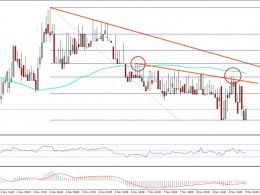
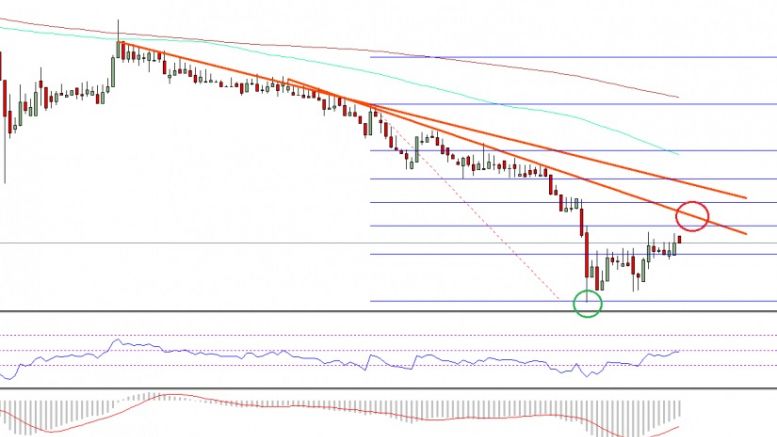
Ethereum price collapsed further and moved towards the $7.50 support against the US Dollar where ETH/USD found buyers and currently recovering. Key Highlights. ETH price extended its downside move against the US Dollar and Bitcoin, and traded further lower. Yesterday’s highlighted bearish trend lines on the hourly chart (data feed via SimpleFX) of ETH/USD are still in place, and may continue to act as a hurdle for the buyers. The price traded as low as $7.61 and currently recovering back above the $8.00 handle. Ethereum Price Sell? ETH price fell further and broke yesterday’s low against....
Related News
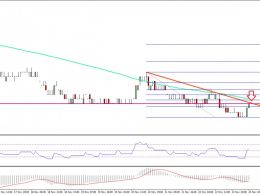
Ethereum price attempted a minor bounce against the US Dollar, but failed. It looks like the ETH/USD may continue to remain in control today. Key Highlights. ETH price struggle to move higher against the US Dollar continued, as it found resistance near $10.75 yesterday. Yesterday’s highlighted trend lines on the hourly chart (data feed via SimpleFX) of ETH/USD are still intact and preventing an upside move. It looks like the price may decline further towards the $10.40 level. Ethereum Price Downsides. ETH price remained under a lot of bearish pressure yesterday against the US Dollar. There....
Ethereum classic price formed yet another low against the Bitcoin, and it looks like ETC/BTC downtrend is still intact. Key Highlights. Ethereum classic price traded further lower against the Bitcoin and broke the last low of 0.00106BTC. The price is currently recovering, but facing sellers near a bearish trend line formed on the hourly chart (data feed via Simplefx) of ETC/BTC. A break above it may initiate further recovery in ETC in the short term. Ethereum Classic Price New Low. ETC price continued to trade lower against the Bitcoin, and also broke yesterday’s low of 0.00106BTC. A new....
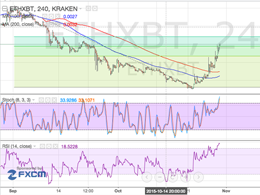
Ethereum Price Key Highlights. Ethereum price has broken above a short-term descending trend line and has been on a steady climb, but it is encountering a bit of resistance at an area of interest. This lines up with the Fib levels and a former consolidation area, which suggests that plenty of limit orders are located there. Ethereum price is still deciding where to go from here, as a selloff could bring it back to the previous lows while an upside breakout could confirm the bull run. Rally Overdone? Technical indicators seem to be suggesting that the rally is overdone, as RSI and....
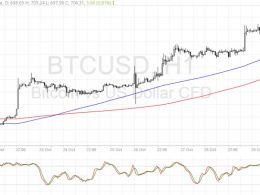
Bitcoin price gave up ground to the dollar on Friday but buyers soon returned at a key area of interest. Bitcoin Price Key Highlights. Bitcoin price sold off quickly on Friday but bulls were waiting to charge at the rising trend line. Price could resume its climb from here as technical indicators on the 1-hour time frame suggest that the uptrend could stay intact. A return in bullish pressure could push bitcoin up to the recent highs near $730 or higher. Technical Indicators Signals. The 100 SMA is above the longer-term 200 SMA on this time frame so the path of least resistance is still to....
Ethereum price fell further, as the Eth sellers were seen in control. Going forward, there are chances of additional downsides in the short term. Key Highlights. ETH price continued to face sellers versus the US Dollar, and may move down further. There are two bearish trend lines formed on the hourly chart (data feed via SimpleFX) of ETH/USD, which are acting as a resistance. It looks like the pair may easily head towards the $11.60 level where the bulls may appear. Ethereum Price Resistance. Ethereum price remained under heavy selling pressure against the US Dollar this past week. I....

