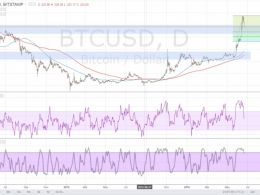
Bitcoin Price Technical Analysis for 12/05/2016 – Time for a Correction!
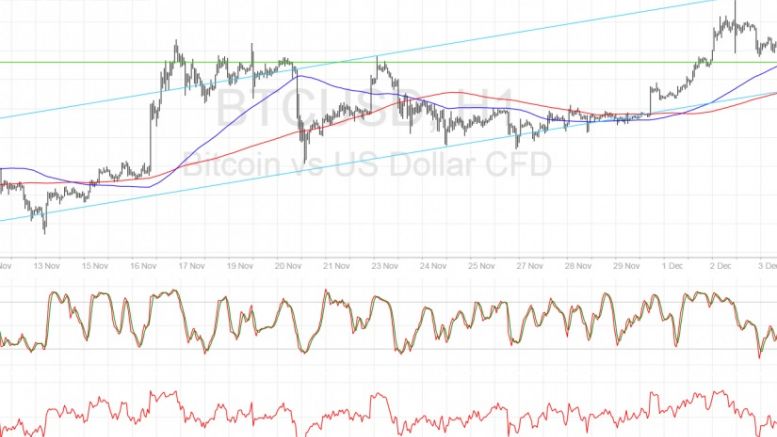
Bitcoin price continues to move in an uptrend and is currently making a correction to draw more buyers to the mix. Bitcoin Price Key Highlights. Bitcoin price has been consistently trending higher, moving inside an ascending channel formation visible on the 4-hour and 1-hour charts. Price has just bounced off the channel resistance around $800 and is heading back towards support. A bounce from the channel bottom could be in the cards as more bulls are waiting at that area. Technical Indicators Signals. The 100 SMA is above the longer-term 200 SMA so the path of least resistance is still to....
Related News

Bitcoin remains at the same price level from last week, reinforcing the $600 support area for the entire new cycle. Meanwhile, technical analysis indicates that bullish consensus is getting stronger, increasing the likelihood of a rally from $650 to $820. 5th Elliott Wave forecasting, based on Fibonacci numbers, could be calculated to the technical objective around the $820 area, where several theories point to the delayed next stage. From there, a technical correction should send prices back to $700, giving stragglers a second chance to recalculate their strategies to join. After another....
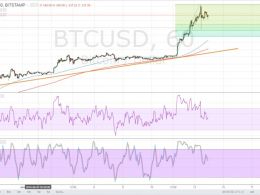
Bitcoin price looks ready to make a correction from its recent rally, giving buyers a chance to hop in the uptrend at better levels. Bitcoin Price Key Highlights. Bitcoin price recently made a strong rally but it looks like bulls are booking profits. This could offer a nice opportunity to enter on a short-term correction from the sharp climb. Using the Fibonacci retracement tool on the latest swing low and high on the 1-hour time frame shows potential entry points. Technical Indicators Signals. The 100 SMA is above the longer-term 200 SMA so the path of least resistance is to the upside.....
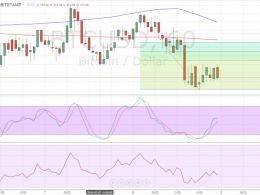
Bitcoin price is finding support at the 38.2% Fibonacci retracement level but a larger pullback might be due. Bitcoin Price Key Highlights. Bitcoin price is still selling off, moving towards the 38.2% Fib or the $650 area as predicted in the previous article. Price appears to have found a bit of support at this area, forming a long spike after the test and still deciding whether to resume the climb or to make a larger pullback. Technical indicators appear to be suggesting that the correction is still far from over. Technical Indicators Signals. The 100 SMA is above the 200 SMA so the....
Bitcoin price showed bearish momentum but sellers might need to make a correction before taking it lower. Technical indicators are giving mixed signals for now. Using the Fib tool on the latest breakout move shows that the 38.2% correction level lines up with a broken short-term support around $373. the 61.8% Fib is close to the 200 SMA, which typically acts as a dynamic resistance level. However, the 100 SMA is still above the 200 SMA so the path of least resistance might be to the upside and bitcoin price could go for another round of gains. A downward crossover appears to be brewing....
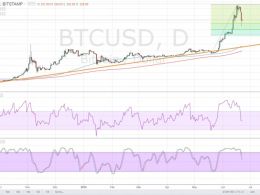
Bitcoin price gave in to overbought conditions and is in the middle of a large correction to an area of interest. Bitcoin Price Key Highlights. Bitcoin appears to have hit a ceiling at the $775 mark, making a break below a short-term consolidation pattern and moving towards the nearby support. Price is now trading below the $700 mark and could head further south until $650, which is close to the 38.2% Fibonacci retracement level and a former resistance. A bounce off this correction area could allow bitcoin price to resume its climb to the recent highs and beyond. Technical Indicators....