Bitcoin Price Technical Analysis for 12/19/2016 – Breaking Past $800!
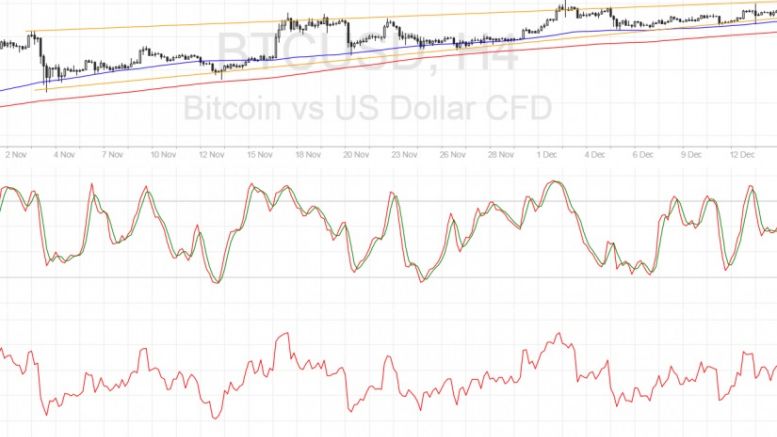
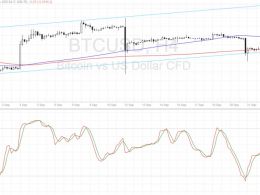
Bitcoin price is slowly treading higher, trying to muster enough energy for a strong break past $800. Bitcoin Price Key Highlights. Bitcoin price broke above its short-term consolidation and is on its way to making a solid move past $800. Price is still moving carefully inside a rising wedge formation visible on its 4-hour chart. If the wedge resistance continues to keep gains in check, bitcoin price might be forced to break below support. Technical Indicators Signals. The 100 SMA is above the longer-term 200 SMA so the path of least resistance is to the upside. However, the gap between....
Related News
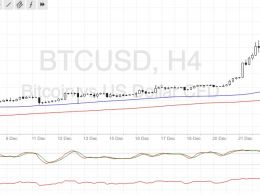
Bitcoin price is bracing itself for a strong finish for the year, as it raked in more gains above $900. Bitcoin Price Key Highlights. Bitcoin price carried on with its climb as expected, after breaking past the $800 barrier a few days back. Price topped near $950 before making a pullback on Christmas Day, which then offered bulls a chance to add to their long positions or draw more buyers in. Price could be on its way to breaking past the recent highs from here. Technical Indicators Signals. The 100 SMA is above the longer-term 200 SMA on the 4-hour time frame of bitcoin, confirming that....
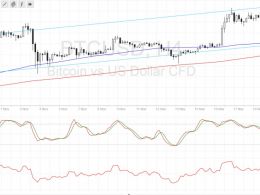
Bitcoin price found support at the bottom of its ascending channel visible on the 4-hour time frame, but buying pressure seems weak. Bitcoin Price Technical Analysis. Bitcoin price halted its sharp drop yesterday, bouncing off the ascending channel support illustrated in the previous post. Buyers seem to be getting back in the game at that point, possibly yielding another climb back to the resistance at $780. Technical indicators are giving mixed signals for now so a breakdown might still be possible. Technical Indicators Signals. The 100 SMA is above the longer-term 200 SMA so the path of....

Ethereum price seems to have its sights set higher after breaking out of a descending triangle on its 4-hour chart. Technical indicators are also supporting further gains. Ethereum price had previously consolidated inside a descending triangle pattern, forming lower highs and finding support at 0.00250. At the moment, ethereum price is testing the near-term resistance at the 0.00300 level, waiting for more bulls for another leg higher. An upside break past this level could take it up to the next area of interest at 0.00330-0.00350 then onwards to the larger triangle highs at 0.00400.
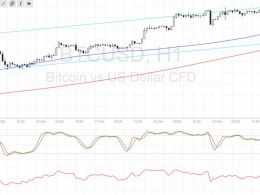
Bitcoin price could make a correction before resuming its climb past the $1000 mark and the short-term time frames illustrate potential pullback areas. Bitcoin Price Key Highlights. Bitcoin price seems to be having trouble breaking past the $1000 mark so a pullback might be in order. On the 1-hour time frame, an ascending channel can be seen and a pullback to support at $940 might be in the works. The channel support lines up with a broken resistance area and another dynamic inflection point. Technical Indicators Signals. The 100 SMA is above the longer-term 200 SMA so the path of least....
Bitcoin price looks ready to resume its climb as the ascending channel support is still holding. Bitcoin Price Key Highlights. Bitcoin price is still hovering around the bottom of the ascending channel on its 4-hour time frame. Bullish momentum seems to be returning as price made a more convincing bounce and is in a continuation pattern. A bullish flag pattern has formed after the recent sharp rally, and a break past this formation could seal in more gains. Technical Indicators Signals. The 100 SMA is still above the longer-term 200 SMA, indicating that the path of least resistance is to....