Bitcoin Price Technical Analysis for 01/05/2017 – More Bullish Momentum Past $1200?
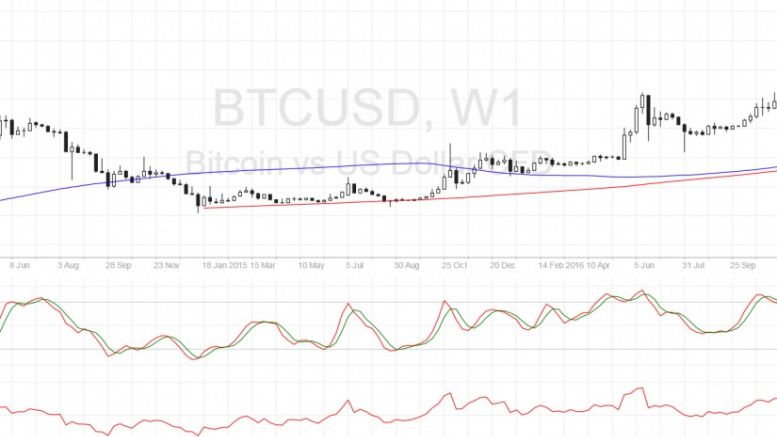
Bitcoin price is starting to establish new record highs, indicating a strong start for 2017 on increased investor interest. Bitcoin Price Key Highlights. Bitcoin price followed through with its long-term bullish candlestick continuation pattern. Price has already taken out the record highs around $1200 at the very start of this year, hinting that further gains are in the cards. Bitcoin seems to be setting its sights on the $1300 major psychological level next as the bullish momentum seems unstoppable for now. Technical Indicators Signals. The 100 SMA remains above the longer-term 200 SMA....
Related News
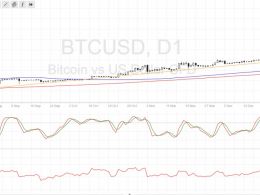
Bitcoin price suffered a sharp crash upon hitting a strong ceiling, inspiring a major pullback that could revive bullish interest. Bitcoin Price Key Highlights. Bitcoin price made a sharp much-needed tumble after price hit record highs around the $1200 area. As predicted in an earlier article, that long-term resistance level is likely to inspire a lot of profit-taking that might unwind the cryptocurrency’s gains. Price is still trending higher on the daily chart, though, and bulls might be eager to hop in the climb at these bargain prices. Technical Indicators Signals. The 100 SMA is....

Bitcoin remains at the same price level from last week, reinforcing the $600 support area for the entire new cycle. Meanwhile, technical analysis indicates that bullish consensus is getting stronger, increasing the likelihood of a rally from $650 to $820. 5th Elliott Wave forecasting, based on Fibonacci numbers, could be calculated to the technical objective around the $820 area, where several theories point to the delayed next stage. From there, a technical correction should send prices back to $700, giving stragglers a second chance to recalculate their strategies to join. After another....

The past 24 hours have seen bullish momentum return to XRP, with the cryptocurrency now reclaiming the $2.5 price level. This bullish momentum comes after a seven-day stretch of range consolidation between resistance at $2.5 and support at $2.3. Despite this consolidation of the price, technical analysis shows that XRP is still trading in a bullish setup, especially on the daily candlestick timeframe. Notably, this bullish setup shows that the XRP price is about to make a new all-time high run to $5. Bullish RSI Divergence And Strong Support Set The Stage Technical analysis of the XRP....
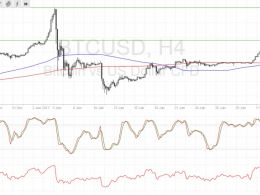
Bitcoin price seems to be aiming higher as bulls keep pushing it past one upside barrier after another. Bitcoin Price Key Highlights. Bitcoin price continues to rally, taking out one resistance level after another in the past few days. Bullish pressure is still strong and seems enough to carry price past the nearby ceiling at $1080-1100. In that case, the path is open for a move up to the January highs close to $1300. Technical Indicators Signals. The 100 SMA recently crossed above the longer-term 200 SMA on the 4-hour chart, confirming that the uptrend is more likely to carry on than to....

The highly volatile digital currency seems to have gone into a hibernation mode, barely moving in the past one week. As mentioned inyesterday's analysis, the bulls are finding it tough to pose serious threats to the shorts as Bitcoin still lingers around $290. Technical analysis on the 240-minute BTC/USD price chart reveals that the consolidation period may extend for a while. Moving Average Convergence Divergence - The Signal Line is slowing catching up with the MACD and as a result, the Histogram value is retracting to 0. A declining Histogram value indicates that the bulls are losing....