Bitcoin Price Technical Analysis for 01/24/2017 – Reversal Candlesticks Sighted
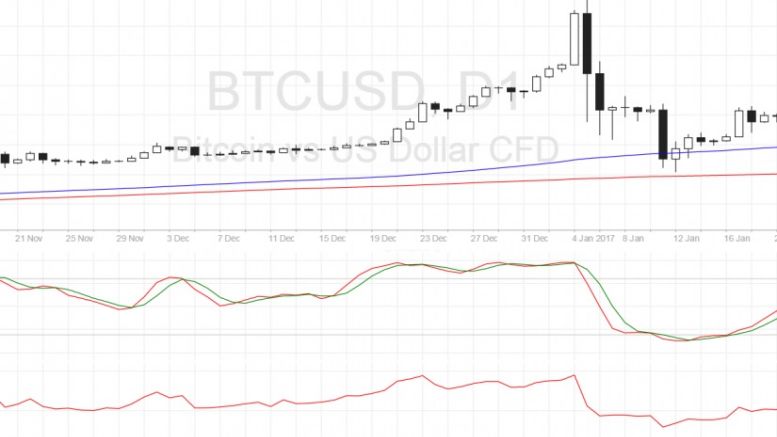
Bitcoin price could be gearing up for a slide as a doji candlestick can be seen on the daily time frame. Bitcoin Price Key Highlights. Bitcoin price seems to be having a tough time pushing past the $900 area, as reversal candlesticks have formed around the area of interest. The $900-950 level has held as support and resistance in the past and appears to be functioning as a ceiling now. A doji can be seen on the daily time frame with the next candles indicating hesitation. Technical Indicators Signals. The 100 SMA is above the longer-term 200 SMA on the daily time frame so the path of least....
Related News
Ethereum Price Key Highlights. Ethereum price is gaining downside momentum as it proceeds to create new record lows below 0.00211BTC. No reversal candlesticks are in sight just yet, indicating that the selloff could carry on. Ethereum price seems to be aiming for new lows, as more sellers hopped in on the recent break from consolidation. Technical indicators are also suggesting that further losses are likely. Not yet oversold? On the daily chart of ethereum price, stochastic and RSI are still pointing down, which suggests that price can keep heading south. Shorter-term time frames don't....
Darkcoin price dropped during yesterday's and today's trading sessions to score a low of around 0.01101 BTC, as we predicted during yesterday's analysis. By studying the 1 hour Cryptsy (DRK/BTC) charts from tradingview.com and keeping the Fibonacci retracements as per our yesterday's analysis (look at the below chart), we can notice that DRK price declined from a high of around 0.01265 to a low of 0.01101 earlier today. As the price was declining, the support level at 0.01085 supported darkcoin price and resisted a further drop as shown by: The 2 Dojis forming on the 1 hour charts (look at....
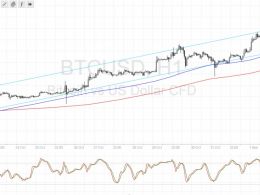
Bitcoin price could be in for a drop from the channel resistance, offering another chance to buy on the dips to support. Bitcoin Price Key Highlights. Bitcoin price is still trading inside its short-term ascending channel and is currently testing the resistance. Reversal candlesticks have formed at this level so it’s likely that bulls could book profits and trigger another dip to the channel support. Technical indicators are showing that the uptrend could continue but that a pullback is due. Technical Indicators Signals. The 100 SMA is above the longer-term 200 SMA so the path of least....
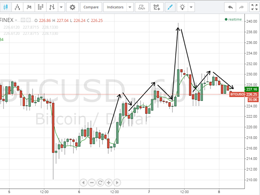
Bitcoin price advanced to around $240 today after we spotted a bullish wave which started yesterday. Today's bitcoin price increase is highly considerable given the bearish wave that has been dominating the market throughout the past 2 weeks. By studying the 1 hour Bitfinex (BTC/USD) charts from tradingview.com (look at the below charts), we can notice that today's trading led to a repetitive pattern of candlesticks. 3-5 green bullish candlesticks followed by 2-3 red bearish candlesticks which is a pattern that has been pushing the price upwards earlier today. Each bullish wave is followed....
Don’t be alarmed by the current slump in the bitcoin price. In fact, there is still cause for optimism. The market is going through a reversal pattern to the $700 level, where a congestion area should reinforce quotes for another climb to $820, keeping us right on track to hit the projections advanced last week. Bitcoin Price Analysis: Bulls Still in Control. Long-Term Analysis. After testing the lowest support at the $580-$600 level, prices should enter an upward reversal pattern soon, which will allow an initial pull back to $700, extended to Fibonacci´s technical objective at $820. The....


