Ethereum Price Technical Analysis – ETH/USD Correction Initiated
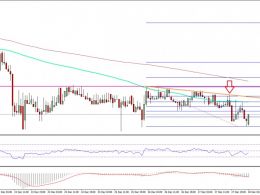
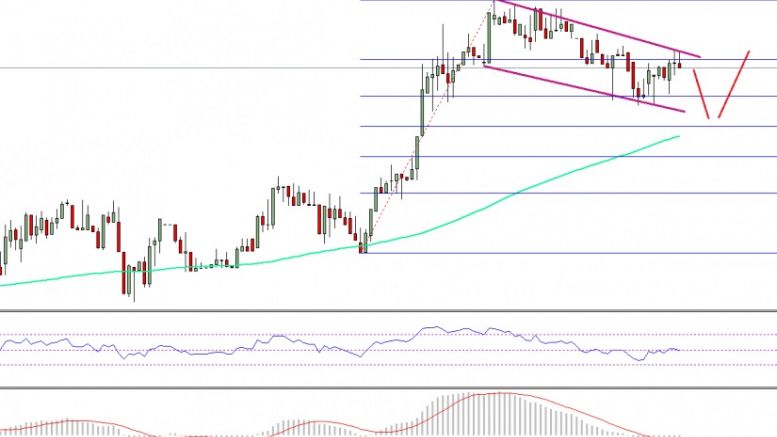
Ethereum price after trading a few points above $11.20 struggled against the US Dollar, and now ETH/USD has started a correction wave. Key Highlights. ETH price after a nice upside move against the US Dollar found resistance near $11.22, and started a correction. There is a descending channel pattern formed on the hourly chart of ETH/USD (data feed via SimpleFX), which is acting as a downside move catalyst. The price may dip towards $10.90 before gaining bids once again for an upside move. Ethereum Price Trend. There was a nice uptrend initiated in ETH price against the US Dollar, as there....
Related News
Ethereum price failed to gain momentum against the US Dollar, and failed near $7.20. More losses are likely in ETH/USD moving ahead? Key Highlights. ETH price started a correction wave yesterday against the US Dollar, but it looks it failed to gain traction. There is a new minor bearish trend line formed on the hourly chart (data feed via SimpleFX) of ETH/USD, which is currently acting as a resistance. The price is back trading near the last swing low of $6.87, and remains at risk. Ethereum Price Decline. Yesterday, there was a correction wave initiated in ETH price against the US Dollar.....
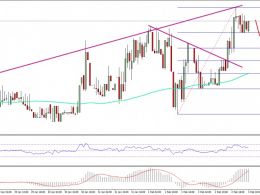
Ethereum price is back in the bullish zone after a mild correction against the US Dollar, and it looks like ETH/USD may break $10.65 soon. Key Highlights. ETH price gained pace after a correction towards the $10.35 support against the US Dollar. This week’s highlighted connecting resistance trend line on the hourly chart of ETH/USD (data feed via SimpleFX) is still acting as a resistance near $10.65. The price may once again correct a few points down before making an attempt to break $10.65. Ethereum Price Resistance. There was a minor correction initiated in ETH price against the US....
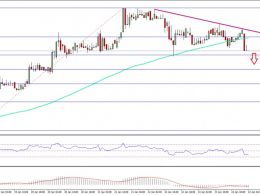
Ethereum price started a substantial correction yesterday against the US Dollar, and it looks like ETH/USD may trade towards $10.20 in the short term. Key Highlights. ETH price started a correction after trading as high as $10.84 against the US Dollar. There is a bearish trend line formed on the hourly chart (data feed via SimpleFX) of ETH/USD, which is pushing the price down with resistance near $10.55. The pair has also moved below the 100 hourly simple moving average at $10.54, which is a bearish sign. Ethereum Price Correction. Yesterday, I highlighted the start of a correction in ETH....
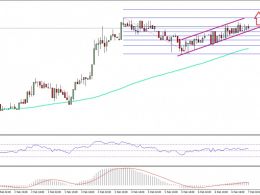
Ethereum price likely completed a correction wave against the US Dollar, and ETH/USD might now trade back towards the last high of $11.30. Key Highlights. ETH price after a minor correction against the US Dollar towards $10.88 found support. Yesterday’s highlighted descending channel pattern on the hourly chart of ETH/USD (data feed via SimpleFX) was broken at $11.05 for an upside move. Now, an ascending channel pattern is formed with support at $11.10. Ethereum Price Support. Yesterday, we saw how there was a correction wave initiated in ETH price against the US Dollar towards $11.00. The....
Ethereum price upside move stalled near $13.20 against the US Dollar, and the ETH/USD pair is now consolidating and preparing for the next move. Key Highlights. ETH price after finding resistance near $13.22 against the US Dollar started a consolidation phase. It looks like a contracting triangle pattern is formed on the hourly chart of ETH/USD (data feed via SimpleFX) with support at $12.50. The pair might test the $12.50-40 support area before making an attempt to move higher once again. Ethereum Price Breakout Pattern. Yesterday’s upside move in ETH price came to a halt near $3.20....

