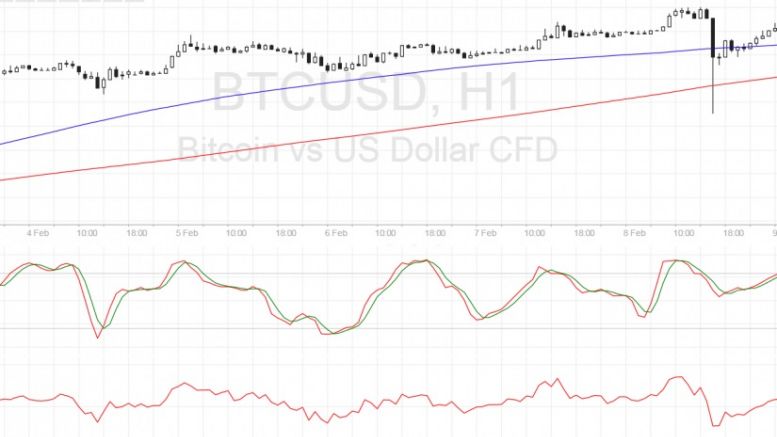
Bitcoin Price Technical Analysis for 02/09/2017 – What’s Up with that Sharp Drop?
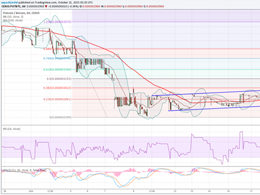
Bitcoin price made a quick spike down but the uptrend remains intact as bulls look eager to defend the floor. Bitcoin Price Key Highlights. Bitcoin price was on a steady climb when it suddenly made a sharp selloff close to $1000. Price quickly recovered from this drop and resumed trading back to its previous levels. This suggests that bullish pressure is very strong and that buyers are simply waiting for cheaper levels to load up on their long positions. Technical Indicators Signals. The 100 SMA is above the longer-term 200 SMA so the path of least resistance is still to the upside. In....
Related News
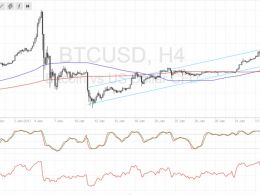
Bitcoin price suffered a sharp decline, which might be a sign that the climb is over and that further losses are underway. Bitcoin Price Key Highlights. The recent sharp drop in bitcoin price turned out to be an omen for an even larger selloff, causing a break below the ascending channel support. This breakdown suggests that a reversal from the previous uptrend could be in the cards, possibly taking it down to the lows near $700. News from China combined with strong dollar demand triggered the huge selloff. Technical Indicators Signals. The 100 SMA is still above the 200 SMA on this time....
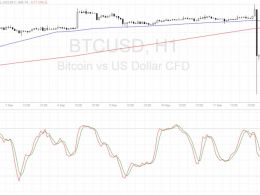
Bitcoin price is pulling up from its sharp drop but could encounter resistance at the nearby inflection points. Bitcoin Price Key Highlights. Bitcoin price recently made a sharp selloff, breaking below a short-term floor around $620 and bouncing off the $570 area. Bearish momentum could still be in play, although a correction to the broken support seems imminent. Technical indicators are also suggesting that the selloff could resume at some point. Technical Indicators Signals. The 100 SMA is starting to cross below the longer-term 200 SMA to show that the path of least resistance is to the....
Bitcoin price has exhibited strong bearish momentum but is in the middle of a retracement from its sharp downside move. Bitcoin Price Key Highlights. Bitcoin price made a strong bounce after its sharp drop, reflecting a correction for sellers. Price could pull up to the broken consolidation support or to the moving averages before resuming its drop. The recent hack on a bitcoin exchange in Hong Kong has put downside pressure on prices. Technical Indicators Signals. The 100 SMA is below the longer-term 200 SMA, signifying that the path of least resistance is to the downside and that further....
Potcoin Price Key Highlights. Potcoin price continued to trade inside a flag pattern as highlighted in one of the recent technical analysis. Both buyers and sellers seem to be struggling to take the price in one particular direction, which created a range inside the flag pattern. A few technical indicators are pointing towards more losses and a break below the flag pattern. Potcoin price is trading inside a range and it looks like heading towards a break, waiting for a catalyst. Break Down? As mentioned in the previous analysis, there was a sharp decline noted in the Potcoin price which....
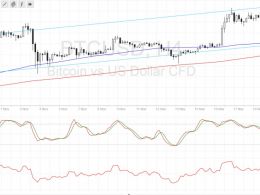
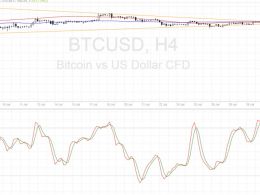
Bitcoin price found support at the bottom of its ascending channel visible on the 4-hour time frame, but buying pressure seems weak. Bitcoin Price Technical Analysis. Bitcoin price halted its sharp drop yesterday, bouncing off the ascending channel support illustrated in the previous post. Buyers seem to be getting back in the game at that point, possibly yielding another climb back to the resistance at $780. Technical indicators are giving mixed signals for now so a breakdown might still be possible. Technical Indicators Signals. The 100 SMA is above the longer-term 200 SMA so the path of....