Ethereum Price Technical Analysis – ETH/USD Near Turning Point
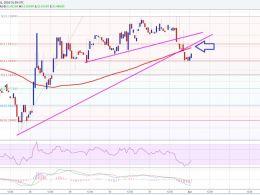
Ethereum price managed to hold the $10.80 support during the recent decline, and ETH/USD may now attempt to retest the last swing high. Key Highlights. ETH price after trading as high as $11.38 found resistance and moved down against the US Dollar. There was an important support trend line at $11.30 of an ascending channel on the hourly chart of ETH/USD (data feed via SimpleFX), which was broken. The price traded towards $10.80 where buyers appeared, and the price bounced back. Ethereum Price Bounces Back. We were following an ascending channel pattern on the hourly chart of ETH/USD (data....
Related News

Ethereum has spent the better part of recent months losing ground to Bitcoin, and this underperformance may now be approaching a turning point, at least according to a new technical outlook shared by crypto analyst CrediBULL Crypto. The technical analysis shows that the ETH/BTC pair is no longer breaking down and is now quietly settling […]
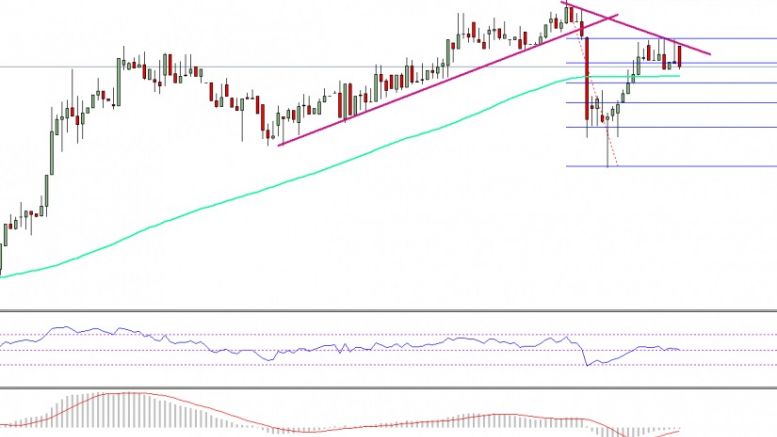
Ethereum price showing a lot of bearish signs. If sellers remain in action, there is a chance of more losses in ETH/USD in the near term. Ethereum price tested the last swing high of $12.12 a couple of times yesterday, but the bulls failed to break the stated level. As a result, there was a downside move, which took ETH/USD below a couple of bullish trend lines formed on the hourly chart (data feed via Kraken). ETH sellers took charge and succeeded in taking the price down against the USD. The most important aspect is that the price is now below the 100 hourly simple moving average. So, if....

The Christmas isn’t turning out to be merry for Bitcoin. The cryptocurrency is struggling near the overhead resistance of $465. It is now trading 1.28% lower at $450.89, raising concerns that the market participants might pull out their funds in the holiday season. As a result, several technical indicators are also showing declines. We advised in the previous Bitcoin price technical analysis Target Achieved that traders should book at least partial profits in their long positions. And for today’s analysis, we will again be using the 4-h BTC-USD price chart from BITSTAMP.

Ethereum price has broken its last year $22 record. What is the reason for such a powerful surge? ETH/USD. What caused the price surge. There are several reasons for the price rally. They arise from the technical analysis and news. One of the major volatility factors is the conference that took place in Sydney, on March 7-9. The event was devoted to the current problems and future opportunities in the crypto industry. As for the technical part of the price rally, Ethereum price has stopped at a key resistance of the $20 point. At that mark, there are key lines ending the entire trend from....
A crypto analyst, who publishes technical analysis to his audience on X, has released a zoomed-out weekly Ethereum chart that interprets the current price weakness as the final stage of a multi-year accumulation cycle. As it stands, the Ethereum price is trading around $2,100 and 57% below its peak. Therefore, the technical analysis is suggesting that […]