Ethereum Price Technical Analysis 04/01/2016 – Short-term Turning Point
Ethereum price showing a lot of bearish signs. If sellers remain in action, there is a chance of more losses in ETH/USD in the near term. Ethereum price tested the last swing high of $12.12 a couple of times yesterday, but the bulls failed to break the stated level. As a result, there was a downside move, which took ETH/USD below a couple of bullish trend lines formed on the hourly chart (data feed via Kraken). ETH sellers took charge and succeeded in taking the price down against the USD. The most important aspect is that the price is now below the 100 hourly simple moving average. So, if....
Related News
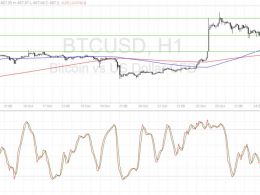
Bitcoin price had a volatile run but remains stuck inside its short-term range. Bitcoin Price Key Highlights. Bitcoin price volatility picked up recently but it was unable to bust out of its range. Both bulls and bears attempted for a breakout but the cryptocurrency is still trapped between support at $658 and resistance at $670. Technical indicators are suggesting that the longer-term climb could carry on and that another upside breakout attempt could take place. Technical Indicators Signals. The 100 SMA is still above the longer-term 200 SMA, which means that the path of least resistance....
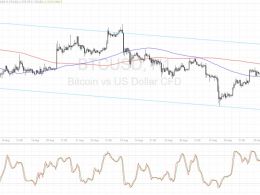
Bitcoin price could be ready to resume its selloff upon testing the descending channel resistance visible on its short-term charts. Bitcoin Price Key Highlights. Bitcoin price is still trending lower on its short-term time frames, moving inside a descending channel on its 1-hour chart. Price is on a climb but might be due for a selloff soon since it is already near the ceiling at the channel resistance. A short-term double-top can be seen, also suggesting a reversal from the recent rally. Technical Indicators Signals. The 100 SMA is below the 200 SMA on this time frame, which means that....

Ethereum Price Key Highlights. Ethereum price is starting a new short-term downtrend on its 1-hour time frame, with a descending channel connecting the latest highs and lows. Price is currently testing the channel resistance at 0.00260 and may be ready for a move back to the bottom at 0.00220. Ethereum price appears ready for a quick drop, as technical indicators on the 1-hour time frame suggest that bears are in for a quick play. Bearish Signals Seen. Stochastic hasn't quite reached the overbought zone yet but the oscillator is already turning lower, indicating a return in bearish....
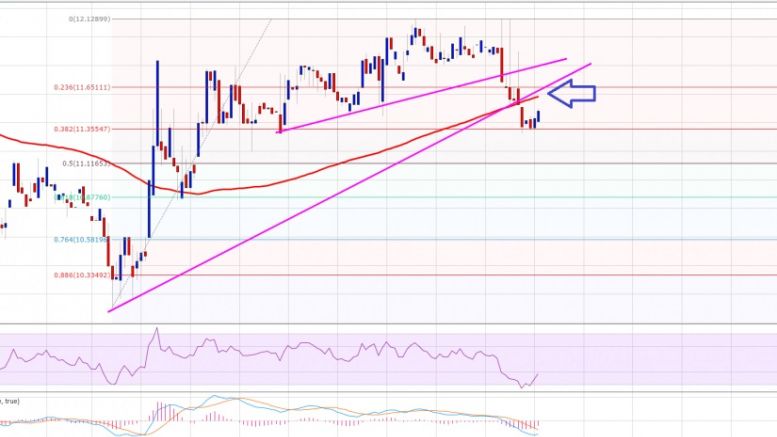
Ethereum price moved above a major resistance area intraday. Buying dips may be a good option in the short term as long as it is above $10.50. Intraday Support Level can be $10.50. Intraday Resistance Level may be $12.00. Yesterday, I stated that if Ethereum price manages to close above the 100 simple moving average (hourly, data feed via Kraken), then we can consider a buy trade. The idea worked perfectly, as there was a break and close above the stated MA and there was a nice upside move. The price traded as high as $12.00, where it found sellers and moving ahead may correct a few points....

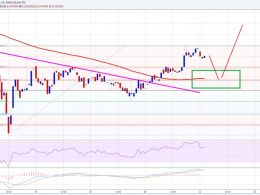
Ethereum Price Key Highlights. The downtrend on ethereum price action appears to be slowing down, as bears don't seem to be too eager to take it down to new lows. After breaking below the earlier triangle consolidation pattern, ethereum price seems to be losing momentum and might be in for a short squeeze around the recent levels. Ethereum price might need to make a correction from its recent drop in order to draw more sellers to push for new lows. RSI Bullish Divergence. Technical indicators appear to be showing that a rally is about to take place, as RSI is reflecting downtrend....