
ADA Charts Turn Bearish – Technical Indicators Signal More Pain Ahead
Cardano (ADA), once hailed as a top contender in the blockchain space, is now facing a challenging phase as its price charts take a sharp turn for the worse. Over the past few weeks, ADA has struggled to maintain its footing, with technical indicators increasingly pointing to the possibility of further downside With market sentiment tilting toward caution, traders and investors are closely monitoring ADA’s next moves. Will the current bearish setup trigger a sharper decline, or can ADA stabilize and mount a comeback? A Breakdown Of Recent Market Movements Recent market movements for ADA....
Related News

Cardano might just be the next crypto to explode, suggest technical indicators and macro shifts. Bullish patterns have flooded the charts, jolting traders awake. The slowdown in the US job market, on the other hand, hints at an upcoming Fed rate cut. An important SEC ETF decision further adds to the speculation. Together, they could […]

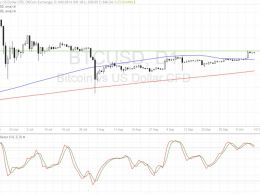
Bitcoin price continues declining and we have to ask “why”? Unfavorable news? Bad fundamentals? Truth is: neither – commodities rise and fall due to leveraged speculation in their price charts. Bitcoin price is at a strange juncture: the 4-hour and 1-day timeframes are about to enter a bearish technical condition, yet, a large hand in the market could miraculously find support at current levels. The technical factor that implies that the largest players in the market are interested in decline, is the fact that they have not defended the ascending trendline (blue) that would have secured....

Bitcoin (BTC) is currently experiencing increasing bearish pressure, with technical indicators suggesting a potential decline toward the $63,316 mark. This price drop is driven by factors such as weakening momentum and decreasing trading volume. As Bitcoin targets the $63,316 mark, Investors and analysts are closely monitoring this development, as it may indicate further declines and set the stage for BTC to test lower support levels. This article analyzes Bitcoin’s current price movements and technical indicators signaling a potential further decline for the cryptocurrency focusing....
Bitcoin price closed the month of October with a higher high on the candle closing, a feat that has throughout history always led to a renewed bull run and additional all-time highs. Coinciding with the November monthly open, here are ten bullish Bitcoin price charts that suggest bullish continuation is ahead – but also warns that the eventual end to the market cycle is near as well. Ten Bullish Monthly Bitcoin Price Charts The leading cryptocurrency by market cap has made a higher high on the highest timeframes – a clear signal that the trend has yet to conclude. By pure definition, an....
Bitcoin price is stalling at a strong area of interest visible on the long-term charts, with indicators suggesting that the resistance could hold. Bitcoin Price Key Highlights. Bitcoin price is consolidating on its short-term time frames and for good reason. Price is actually testing a major area of interest at $645-650, as this held as support in the past and could keep holding as a ceiling. Technical indicators on the longer-term charts are giving mixed signals at the moment. Technical Indicators Signals. The 100 SMA is above the longer-term 200 SMA on the daily time frame, showing that....