
Quant Explains How Bitcoin NUPL Cycles Are Getting Less Volatile With Time
Bitcoin NUPL data suggests that the crypto’s cycles are getting less sharper with time as profit tops and loss bottoms aren’t following a horizontal line. Bitcoin NUPL Didn’t Exceed The 0.75 “Greed” Mark During This Cycle As explained by an analyst in a CryptoQuant post, the BTC profit and loss cycles shouldn’t be treated with horizontal lines. The “Net Unrealized Profit and Loss” (or the NUPL in brief) is an indicator that tells us whether the market as a whole is holding a net profit or a net loss right now. The metric’s value is....
Related News

A quant breaks down how the Bitcoin NUPL indicator may be able to predict the beginning of a new bull run based on past pattern. How The Bitcoin NUPL Metric May Predict The Start Of Bull Run As explained by an analyst in a CryptoQuant post, the various phases of the NUPL indicator may shed some light relating to the bull run status for BTC. The net unrealized profit and loss (or NUPL in short) is a metric that’s defined as the difference between the market cap and the realized cap, divided by the market cap. NUPL = (Market Cap – Realized Cap) ÷ Market Cap In simpler terms, what....
On-chain data shows the Bitcoin funding rates have remained at positive values recently as the crypto’s price has continued its recovery. Bitcoin Funding Rates Have Been Mostly Positive During The Past Month As pointed out by an analyst in a CryptoQuant post, the BTC funding rates have been green recently, but not as positive as back between July 18th to 22nd yet. The “funding rate” is an indicator that measures the periodic fee that perpetual futures contract traders are paying each other. When the value of this metric is greater than zero, it means long traders are....
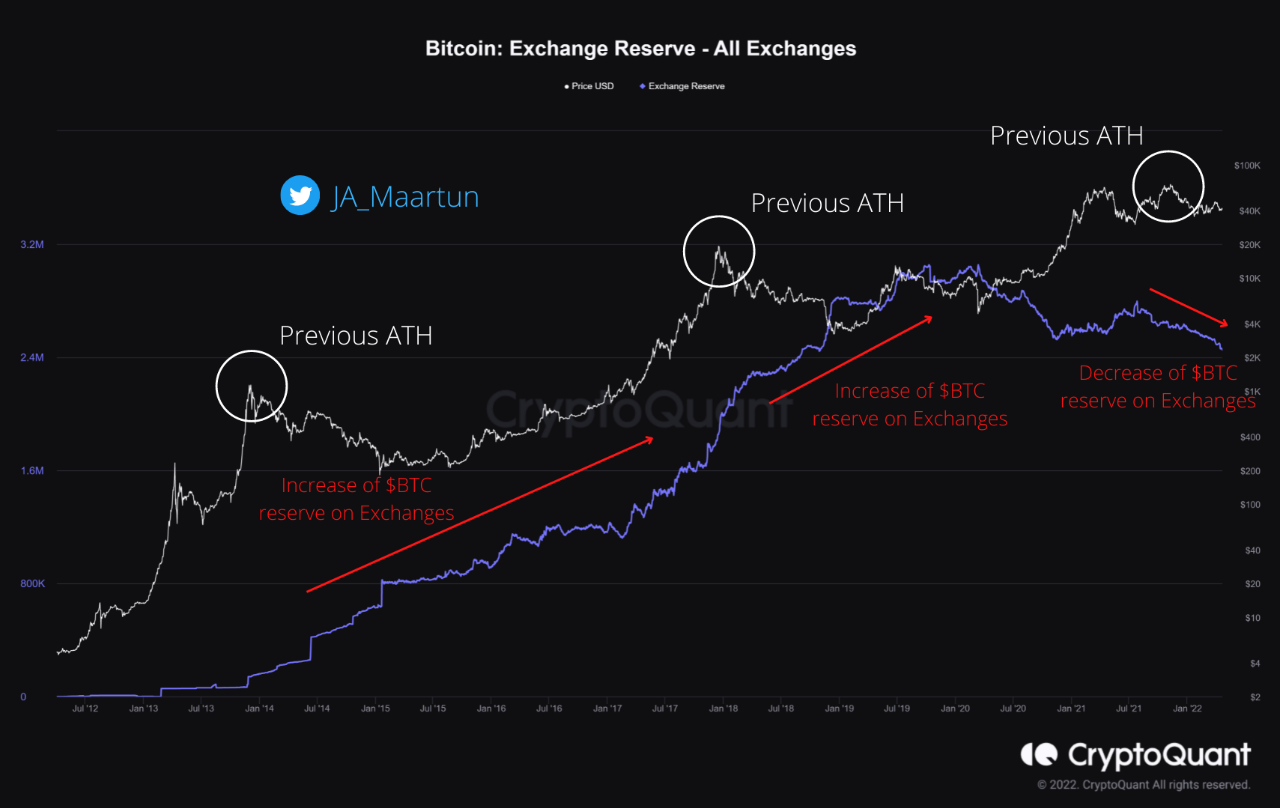
A quant has explained using on-chain data why the current Bitcoin bear market looks to be different from the previous ones. Quant Suggests This Bitcoin Bear Market Is Unlike The Rest As explained by an analyst in a CryptoQuant post, the exchange reserve continuing to trend down since the price all-time high isn’t typical of […]
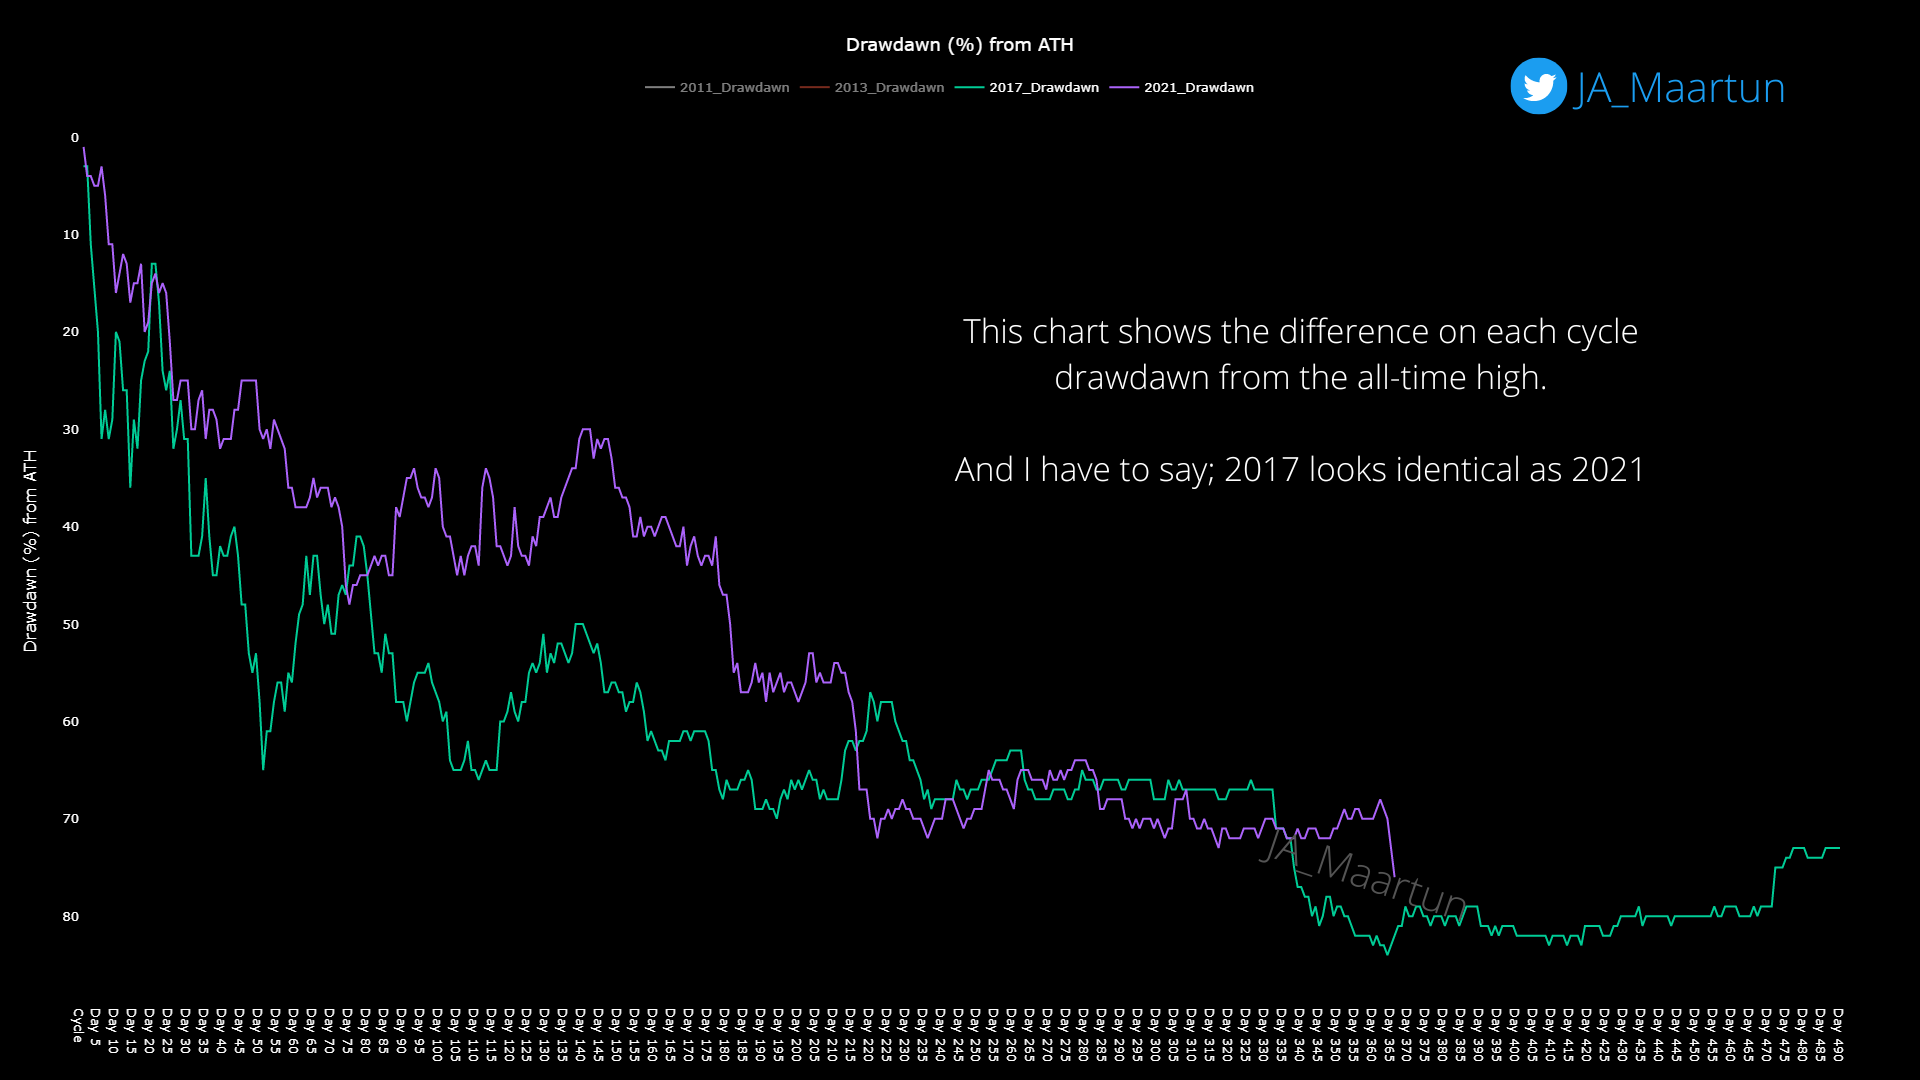
A quant has pointed out the similarities between the 2017 and 2021 Bitcoin cycles, something that could hint at how the rest of this bear market might play out. Both 2017 And 2021 Bitcoin Cycles Saw New Lows Around The 365-Day Mark Since The Top As explained by an analyst in a CryptoQuant post, the two cycles are more similar than one might expect them to be. The indicator of relevance here is the “drawdown from ATH,” which measures the percentage decrease in the price of Bitcoin following the all-time high during each cycle. Here is a chart that shows the trend in this metric....
On-chain data shows the profit margin of the Bitcoin long-term holders is currently the same as when BTC was still $85,000. Here’s what’s behind this. Bitcoin Long-Term Holder NUPL Has Returned To 0.69 In a new post on X, the on-chain analytics firm Glassnode has talked about the trend in the Net Unrealized Profit/Loss (NUPL) for the Bitcoin long-term holders. The NUPL is an indicator that keeps track of the difference between the unrealized profit and unrealized loss held by the BTC investors as a whole. Related Reading: Bitcoin Could See Short-Term Holder Selloff Around These....