
XRP Price Softens Further, Grinding Losses Test Bullish Patience
XRP price extended losses and traded below $1.380. The price is now consolidating losses and faces hurdles near $1.3840 and $1.40. XRP price started another decline and traded below the $1.3840 zone. The price is now trading below $1.380 and the 100-hourly Simple Moving Average. There is a bearish trend line forming with resistance at $1.3840 on the hourly chart of the XRP/USD pair (data source from Kraken). The pair could continue to move down if it stays below $1.3840. XRP Price Dips Again XRP price failed to stay above $1.40 and extended its decline, like Bitcoin and Ethereum. The price....
Related News

XRP price started a fresh increase above $2.550. The price is now facing hurdles above $2.650 and at risk of another decline in the near term. XRP price gained pace for a move above $2.60 and $2.620 before the bears appeared. The price is now trading below $2.60 and the 100-hourly Simple Moving Average. There was a break below a bullish trend line with support at $2.6350 on the hourly chart of the XRP/USD pair (data source from Kraken). The pair could start a fresh increase if it stays above $2.50. XRP Price Retreats Lower XRP price started a fresh increase after it settled above $2.50,....
Ethereum failed to test $1,700 and started a major decline against the US Dollar. ETH declined over 7% and there was a move below the $1,540 support. Ethereum started a major decline below the $1,600 and $1,540 support levels. The price is now trading below $1,600 and the 100 hourly simple moving average. There was a break below a major bullish trend line with support near $1,570 on the hourly chart of ETH/USD (data feed via Kraken). The pair must stay above the $1,500 support to avoid more losses in the near term. Ethereum Trimmed Gains Ethereum climbed above the $1,620 and $1,650....

Bitcoin price continues to struggle to regain any type of bullish momentum, and keeps grinding at repeatedly tested support. In the past, when this happens, the support ultimately breaks down and a cascade of liquidations begin. However, there’s a bullish signal brewing that is thus far the best hope for further continuation to the upside. […]
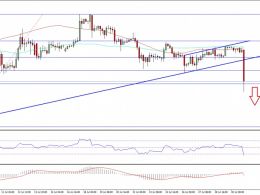
Key Highlights. Dash price is under pressure as sellers managed to clear an important support at 0.01195BTC. A bullish trend line on the hourly chart was breached to take the price lower. Buyers might struggle moving ahead if sellers manage to gain momentum. Dash price is vulnerable to more losses, and if it breaks below the 100 hourly simple moving average, a test of 0.0115BTC is likely. Trend Line break and Reversal. There was an anticipation of an upside move as long as the bullish trend line as highlighted in the yesterday's analysis holds. However, Dash price moved lower recently and....
Bitcoin price failed to sustain the bullish bias against the US Dollar and moved down. Is a test of $620 in BTC/USD possible in the short term? Key Points. Bitcoin price was crushed today against the US Dollar and looks set for more declines in the near term. There was a major bullish trend line formed on the 4-hours chart (data feed from Bitstamp) of BTC/USD, which was broken during the downside move. There was also a bearish flag pattern on the same chart, which was cleared to open the doors for more losses. Bitcoin Price Break? Bitcoin price after a ride towards the $680 level against....