
XRP Coils For A Breakout, But Key Resistance Still Stalls The Rally
XRP remains in a holding pattern, according to the latest chart analysis shared by crypto analyst @CasiTrades. Despite a relatively subdued weekend, XRP continues to trade above critical support levels, indicating that the current bullish structure has not been invalidated. XRP Price Remains Bullish A closer look at the 4-hour XRP/USD chart by @CasiTrades shows two converging trend lines that have formed a symmetrical triangle spanning from mid-January to mid-March. XRP’s price action has respected both the upper and lower boundaries of this formation until early March. Related Reading:....
Related News
Since making a low on the month just above 216 bitcoin rebounded to 230 and start coiling as we can see in the 1H chart. Towards the end of April 21st session, btcusd started to uncoil upwards. Let's take a look at the charts: Bitcoin (BTCUSD) 1H Chart April 22. As we can see in the 1H chart, bitcoin not only broke above a triangle, it also charged above the 230 resistance. There was strong volume, and the 1H RSI popped up above 80. The price action suggests that the bullish breakout is very likely to extend. In the very near-term however, the RSI is overbought, so we can expect some....

Dogecoin is trading inside a well-defined falling wedge on the 12-hour chart, with one technical analyst arguing that an upside breakout could trigger an 80–90% rally into the upper $0.20 range. In a fresh DOGE/USDT update shared on November 25, 2025, trader Clifton Fx (@clifton_ideas) posted a Binance 12-hour chart that spans back to late July. Dogecoin Could Rally Nearly 90% The chart is dominated by two descending trendlines that enclose price action. The upper boundary connects successive lower highs from early autumn through late November, forming a downward-sloping resistance line....

The Dogecoin price looks set to witness a breakout above the psychological $1 level, having broken a resistance trendline. Crypto analyst Trader Tardigrade provided a timeline for when this massive surge could happen as DOGE rallies to a new all-time high (ATH). Dogecoin Price Eyes Rally Above $1 Following Breach Of Resistance Trendline In an […]
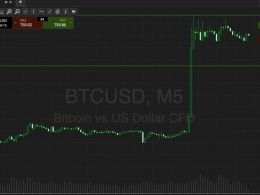
Here's a look at what we are focusing on in the bitcoin price this morning. Well, we asked for a bitcoin price breakout, and a breakout we got. The chart below illustrates it nicely, and we’ll get to that and our key levels shortly, but first, a bit of background. Price has been relatively flat for the past week or so, trading sideways within a circa ten dollar rage defined by 740-750 or thereabouts. In our twice daily analyses, we’ve noted on a couple of occasions that there’s only so much sideways trading we can do, and price generally coils up for a breakout when action looks as it did....
Dogecoin is compressing beneath a dense band of weekly resistance that could unlock a powerful upside continuation once cleared, according to crypto analyst The Great Mattsby (@matthughes13). In his October 5 video, Mattsby frames the 0.618 retracement from the 2021 peak to the 2022 cycle low—marked at $0.26261—as the immediate trigger that “price is still getting rejected at,” adding: “That’s the area of interest to maybe try to close above.” Screenshots of his weekly DOGE/USDT chart show price hovering around $0.248–$0.249 at the time of recording, with a session high near $0.265 and low....