
XRP Price Ready for Bullish Spike: Fading Bearish Momentum and Solid Support
XRP price extended losses and tested the $0.4440 support zone. The price is correcting losses sharply and might soon retest the $0.4720 resistance. XRP price is correcting losses from the $0.4440 support zone. The price is now trading below $0.4650 and the 100-hourly Simple Moving Average. There was a break below a key bullish trend line with support at $0.480 on the hourly chart of the XRP/USD pair (data source from Kraken). The pair might climb higher again if it stays above the $0.450 support zone. XRP Price Revisits Support XRP price struggled to clear the $0.4850 resistance and....
Related News

Last week, Litecoin price saw a spike down from around the 1.60 area down to parity (1.00), which is a new low on the year. The 1H chart shows that after the spike price essentially rebounded back to 1.60 but started drifting lower again. Litecoin (LTCUSD) 1H Chart April 13. Overall, the price action in litecoin has remained the same - bearish with low volatility. 1) The 200-, 100-, and 50-hour SMAs are sloping down and in bearish alignment, with price trading under all 3. 2) The RSI has held under 60 after tagging 30, reflecting maintenance of the bearish momentum. When there is a spike....

Last week, bitcoin found support just above 216 and rebounded to about 230. After that, it ended the week with a bearish continuation attempt, which held back as it found support at a common support around 220. Bitcoin (BTCUSD) 1H Chart April 20. Here are some observations in the 1H chart: 1) Bitcoin Price is under the 200-, 100-, and 50-hour SMA, which means it still maintains a bearish bias as we get ready for another week. 2) The RSI has been oscillating between 30 and 70, which means there is no directional momentum yet. The fact that it is falling below 40 shows that the previous....

Dogecoin is now grappling with a slowdown in momentum that has left many investors wondering if its best days are behind it. After tumbling to the $0.1293 mark, DOGE managed to pull off a notable rebound, suggesting that the bulls aren’t ready to throw in the towel just yet. As market interest shifts toward newer trends and utility-driven tokens, Dogecoin’s fading excitement is becoming hard to ignore. Despite the recent recovery, trading activity remains tepid, and the community buzz that once fueled its rallies appears to be losing steam. Technical Breakdown Of The $0.1293 Bounce....

Bullish momentum appears to be fading on the Bitcoin market as the price of the leading cryptocurrency asset gradually falls back toward the $70,000 level. The growing bearish momentum is driven by heightened selling pressure across the market, backed by a confluence of macroeconomic and political events. Geopolitical Shock Drives Bitcoin Short Interest Several negative […]
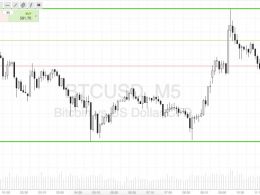
Here's a look at what we are focusing on in the bitcoin price this morning. So, we’re half way through the week, and things are hotting up in the bitcoin price from an intraday perspective. After what was a pretty slow day yesterday, we saw a little bit of up and down overnight and then this morning, just as European markets kicked off for the day, we got a spike in price and some fresh intra-weekly highs produced. Spikes like this are great because they not only serve as an opportunity to get into the market on the breakouts they represent, but they also give us some pretty solid levels....