
Aave v3 launch triggers 50% rally from long-term descending channel pattern
AAVE price broke from its long-term downtrend after the launch of Aave v3 added support for six different blockchain networks in the DeFi space. The decentralized finance (DeFi) market has been undergoing a period of maturation over the past year and many of last year's fast risers have faded into obscurity but this does not mean the formerly "famous" protocols have not continued to build.One blue-chip project that is regaining momentum is Aave (AAVE), a non-custodial liquidity protocol that allows users to lend, borrow or stake their assets to earn yield from their holdings. Data from....
Related News

An analyst has explained how Dogecoin could end up witnessing a rally of around 6,770% if this pattern continues to follow for the meme coin. Dogecoin Has Been Trading Inside A Long-Term Ascending Channel In a new post on X, analyst Ali Martinez discussed a long-term pattern in which the weekly price of Dogecoin has been trading inside. The pattern in question is the Ascending Parallel Channel from technical analysis. A Parallel Channel refers to a consolidation pattern that forms when the price of an asset moves inside two parallel trendlines. The upper line is made by joining together....
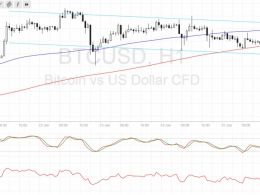
Bitcoin price is slowly making its way down, moving inside a descending channel on its short-term time frames. Bitcoin Price Key Highlights. Bitcoin price seems to have broken below the descending triangle pattern illustrated in an earlier article. Price is establishing short-term downside momentum from here, creating a descending channel visible on the 1-hour chart. Price just bounced off the channel support and could be due for a test of resistance at $930. Technical Indicators Signals. The 100 SMA is above the longer-term 200 SMA so the path of least resistance is still to the upside.....
A cryptocurrency analyst has explained where Ethereum could go next based on a long-term Parallel Channel forming in its monthly price chart. Ethereum Has Been Trading Inside A Parallel Channel For The Last Few Years In a new post on X, analyst Ali Martinez has talked about a long-term pattern that Ethereum has appeared to have been following for the last few years. The pattern in question is a “Parallel Channel” from technical analysis (TA), which forms whenever an asset’s price trades between two parallel trendlines. Related Reading: Bitcoin Could Be Sub-$50,000 By 2028....

In the ever-evolving world of decentralized finance (DeFi) and cryptocurrency, investors are constantly on the lookout for altcoins that offer both short-term gains and long-term stability. Among the myriad of options, Aave (AAVE) and Mpeppe (MPEPE) have emerged as two standout choices for those seeking reliable, long-term profits. While both projects operate in different niches, […]
After a turbulent start to the week, the Stellar price seems to be finding some stability, briefly climbing above the $0.28 level this weekend. This growing momentum has sparked interest from market enthusiasts, with prominent crypto analyst Ali Martinez projecting the XLM token to soon experience a sustained price rise. Related Reading: Bitcoin Price Breaking Out Of This Pattern — Can BTC Reclaim $90,000? XLM Primed For 40% Price Gain In an X post on March 15, Martinez shared an intriguing projection for Stellar price after rebounding off a crucial level. Martinez noted that the altcoin....