
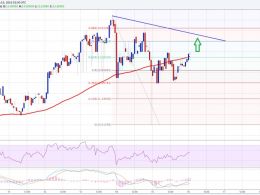
XRP Price Enters Perfect Setup After Buy Retest – Next Stop $3.7
The XRP price is reportedly positioning for a potential breakout as it forms a textbook Falling Wedge pattern, which a crypto analyst calls a perfect bullish setup. After a successful retest of a keg buy zone, technical indicators suggest that XRP is preparing for a powerful move toward the $3.7 level soon. Falling Wedge Setup Signal XRP Price Breakout XRP is currently entering what Robert Mercer, a TradingView crypto analyst, describes as the perfect breakout setup following a prolonged period of consolidation. This technical structure suggests that XRP could potentially experience a....
Related News

“Men lie, women lie, but charts and numbers do not lie,” EGRAG CRYPTO stated in a recent post on X, as he highlighted the importance of the Fib 0.5 level in XRP Dominance. According to him, this level has historically served as a major resistance zone. It acted as a key barrier in October 2019 and November 2020, both instances marking the onset of bear markets. In the current cycle, the Fib 0.5 level has once again proven significant, as it has rejected price advances in January and March 2025. The Knocking On The Door Analogy For XRP To drive his point home, EGRAG CRYPTO introduced what....
Dogecoin is at a technical area that will look very familiar to traders who followed its 2024 rally. The weekly chart shows Dogecoin is pressing into a long-term Fibonacci fan structure drawn from the 2021 peak, with the current retest coming near the 0.618 Fib fan after a similar 0.5 Fib fan retest preceded the large move in October 2024. This technical setup does not confirm a breakout on its own, but it places Dogecoin at one of its most important weekly decision points in months. Related Reading: History Shows Bitcoin ETF Outflows Favor Accumulation, Says Santiment Dogecoin Returns To....
Crypto market analyst Javon Marks believes the Dogecoin price could be preparing for one of its biggest price jumps yet. He thinks this setup gives the coin a strong chance to rise much higher in the current bull market if the pattern continues to repeat as it has before. Marks explains that this pattern is not random but follows historical price data that has proven accurate over time. In his view, Dogecoin has built a reputation for repeating its market behavior during each major cycle. Every time the setup has formed, the price has responded by moving sharply higher. Javon Marks....
Crypto analyst ChartNerd has predicted that the XRP price is about to stage the breakout of the decade. This came as he alluded to a bullish pattern that has been forming since 2024, and is now seeing a critical retest. XRP Price Sees ‘Breakout Of The Decade’ In an X post, ChartNerd stated that the XRP price has secretly handed the market the breakout of the decade. He revealed that a multi-year symmetrical triangle, which finally broke in Q4 2024, leading to a new all-time high (ATH) in July 2025, is now searching for a critical retest. The analyst added that this is the exact setup as....
Ethereum price started to move higher. And, if the bulls remain in action there is a chance of a retest of the $14.20-50 resistance area. Intraday Support Level can be $13.00. Intraday Resistance Level may be $14.20. Ethereum price declined in the 3rd wave to trade near the $12.00 support area, which acted as a perfect buy zone and pushed the price back higher. The price is currently under a minor divergence, suggesting more gains. There is a two point resistance trend line forming on the hourly chart (data feed via Kraken), which can be seen as the next stop for the price. The price has....