
Ethereum’s High Time Frame Structure Looks “Great” Due to Technical Support
Ethereum has undergone a strong correction from the 2020 highs near $490. The leading cryptocurrency currently trades for $345, down 30% from the aforementioned highs. Many investors have pointed to this correction as the start of a longer-term bearish trend for ETH. This may not be the case: analysts say that Ethereum’s long-term outlook is still positive. They cite pivotal technical factors, including but not limited to a strong set of technical levels below ETH’s […]
Related News

Ethereum’s price has been closely tracking that of Bitcoin over the past few days and weeks This has led the cryptocurrency’s bulls and bears to reach an impasse, as both sides have been unable to spark any sustainable trend Where the market trends next will likely depend on BTC, as the cryptocurrency is currently trading between two critical levels One analyst is noting that Ethereum was rejected at a high time frame resistance level yesterday […]

Dogecoin has surged out of its recent consolidation with a decisive breakout, signaling a shift in market momentum. With key levels now flipped and holding as support, the setup points toward the potential for continued upside as buyers remain firmly in control. DOGE Breaks Out As Compression Resolves Upward In a recent technical assessment, Zero Ika highlighted that Dogecoin’s long-standing price compression has finally been resolved to the upside. This shift was marked by a decisive breakout above the asset’s internal market structure. By clearing these key technical hurdles, the....
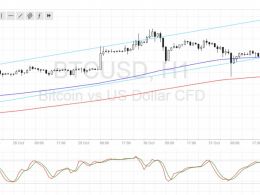
Bitcoin price is resuming its climb after testing the bottom of the ascending channel visible on the 1-hour chart. Bitcoin Price Key Highlights. Bitcoin price continues to trend higher on its 1-hour time frame, moving on a sharper ascending channel than before. Price just bounced off the channel support and seems to be setting its sights on the resistance around $740-750. Technical indicators are suggesting that further gains are in the cards. Technical Indicators Signals. The 100 SMA is safely above the longer-term 200 SMA on this time frame, confirming that the path of least resistance....
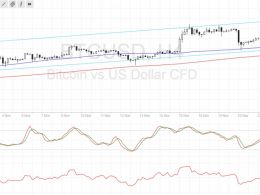
Bitcoin price is testing the ascending channel support visible on the 4-hour time frame and could be gearing up for another rally. Bitcoin Price Key Highlights. Bitcoin price is still trending higher on its 4-hour chart and moving inside the ascending channel previously marked. Price has pulled all the way back to the channel support around $740-745 after previously testing the yearly highs. There are several inflection points at this support zone so a bounce could be due, and technical indicators are suggesting that buyers are about to return. Technical Indicators Signals. The 100 SMA is....
Ethereum shows signs of strength, but the bullish picture only emerges on an inverted chart. On the standard view, the downtrend remains intact until key resistance is reclaimed, making the current optimism conditional. Inverted Structure Reinforces Ethereum Bearish HTF Outlook Presenting an inverted chart in a recent update, Mizer explained that he has been short on Ethereum for several days, outlining what he believes could unfold on the higher time frame (HTF). Mizer clarified that this doesn’t necessarily plan to hold the full position to his projected targets, as he prefers focusing....