“Game On,” Analyst Says as Bitcoin Prints Pivotal Crossover
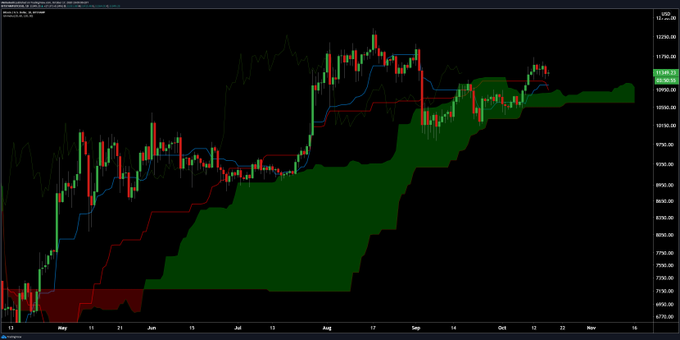
Bitcoin is forming a pivotal buying signal after weeks of consolidation. The cryptocurrency pushed higher over the past 10 days, which allowed this indicator to trend higher to form the buying signal seen today. Bitcoin Prints Pivotal Ichimoku Cloud Crossover Josh Olszewicz, a crypto-asset analyst, recently noted that the cryptocurrency formed a bullish TK Cross as per the Ichimoku Cloud indicator. The indicator is a multi-faceted indicator that shows important price levels along with the […]
Related News
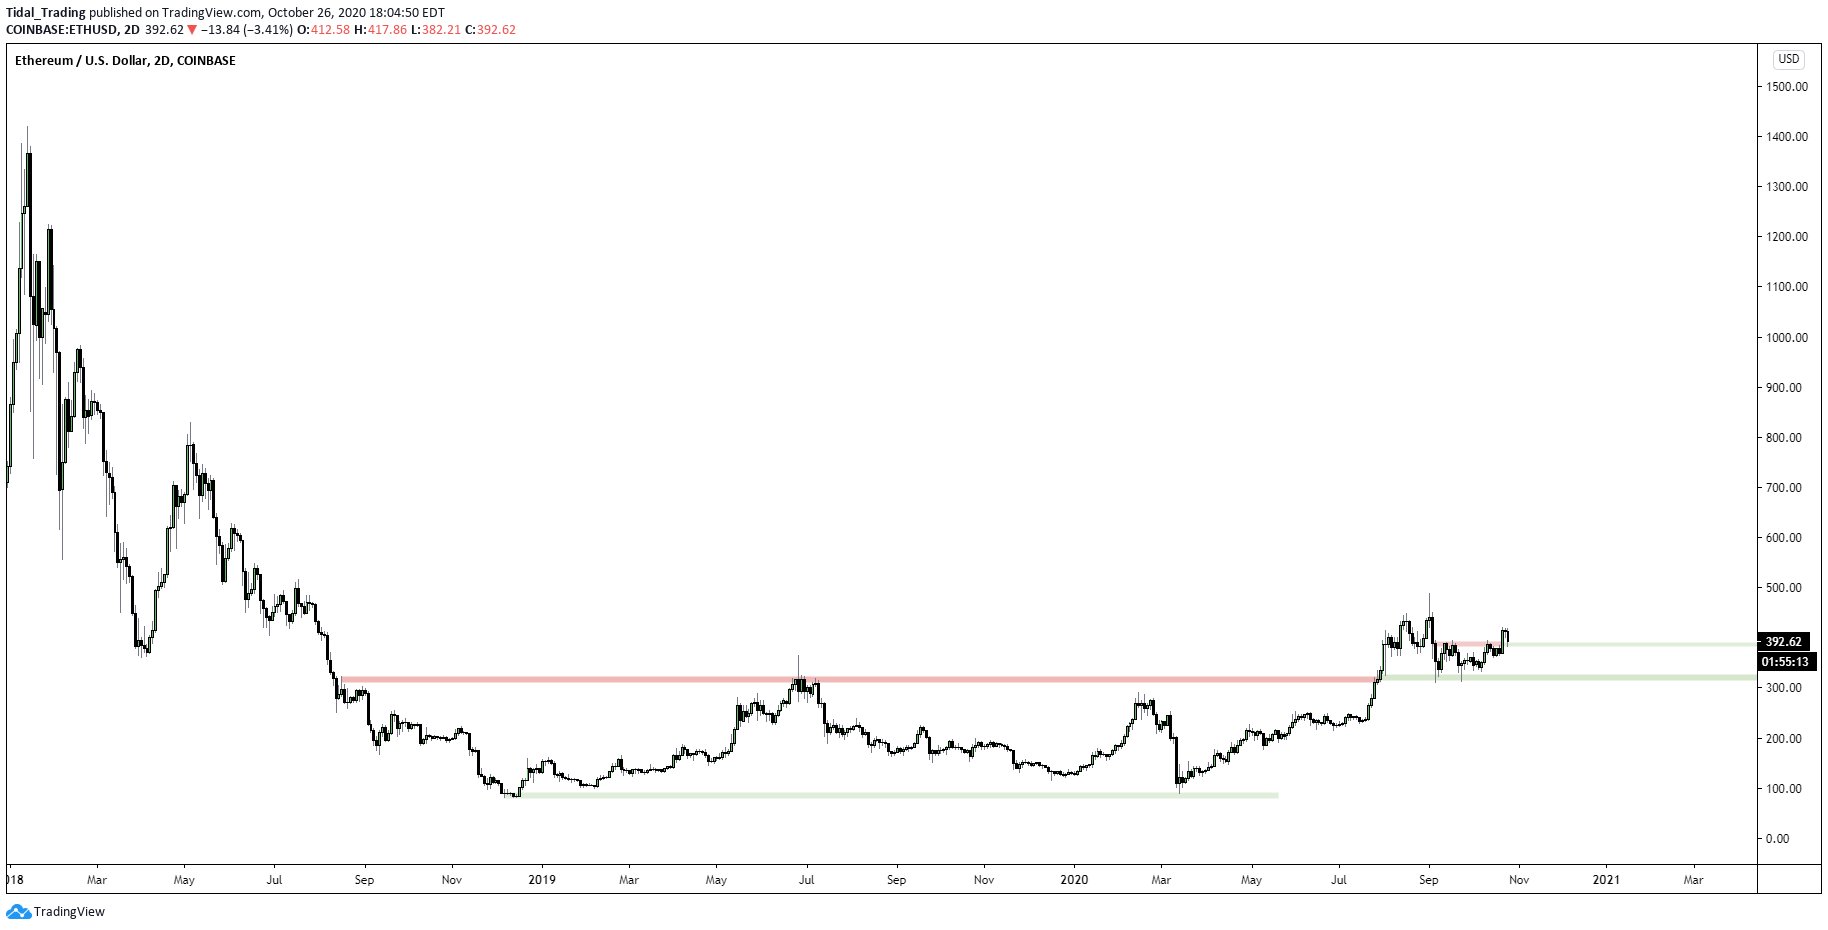
Ethereum is expected to move much higher in the months ahead as the leading cryptocurrency prints a bullish technical signal. Ethereum Bounces Cleanly Off $390 Horizontal Region in Bullish Move As the chart shared below shows, ETH recently bounced off the $380-390 horizontal region, which marks a win for bulls. The chart shows that over the past few months and even stretching into 2018, the high-$300s were an important level for Ethereum to hold. The […]

The Bitcoin 20 DMA seems to have just crossed with the 50 DMA, here is how it might be bullish for the cryptocurrency. The Bitcoin Bullish Crossover As pointed out by a BTC technical analyst on Twitter, two important indicators of the cryptocurrency have just had a crossover. The two metrics are the 20 daily-moving average (DMA) and the 50 DMA. Before looking at the data, it’s best to first get a grasp of both these indicators. Moving averages (MA) help smooth out the price data for Bitcoin as they take averages of the price over a specific period and constantly update or....
A cryptocurrency analyst has pointed out how Bitcoin has recently formed a technical crossover that preceded bearish shifts in the past. Bitcoin Has Seen A Death Cross Between 21-Day & 50-Day SMAs In a new post on X, analyst Ali Martinez has shared a daily price chart for Bitcoin showcasing a crossover between two simple moving averages (SMAs) that the asset has gone through recently. An SMA is a statistical tool that averages a quantity over a given period of time and that, as its name suggests, updates in time with the quantity. This tool can be useful for studying long-term trends, as....

Ethereum strongly underperformed Bitcoin during BTC’s move to $16,000. In fact, for most of the rally from $13,000 to $16,000, ETH was trading for $380-400, failing to break higher. But after BTC has begun to consolidate, ETH has finally started to break higher. Ethereum currently trades for $440, up 10% in the past 24 hours […]
The XRP price could be on the verge of a massive crash, as a crypto analyst has identified a key technical pattern in the cryptocurrency’s structure that signals a potentially severe downturn. According to the analyst, this formation has appeared only twice in XRP’s history, and each time has preceded a devastating loss. If the pattern were to repeat, the cryptocurrency could be headed for more pain. The analyst warns traders and investors to stop buying XRP at this time, citing heightened risk. Analyst Advices Against Buying XRP As Price Crash Looms An urgent warning from market analyst....