
XRP Price Action Signals Strength, More Upside Potential Ahead
XRP price is showing positive signs above the $2.950 zone. The price is consolidating and might aim for a fresh move above $3.120. XRP price is consolidating above $2.920 and $2.950 levels. The price is now trading above $2.950 and the 100-hourly Simple Moving Average. There is a rising channel forming with resistance at $3.120 on the hourly chart of the XRP/USD pair (data source from Kraken). The pair could continue to move up if it stays above the $2.950 zone. XRP Price Eyes Fresh Increase XRP price remained in a positive zone after it settled above the $2.850 zone, unlike Bitcoin and....
Related News

Bitcoin’s price has climbed to the $99,000 level once again, sparking renewed hope about its potential to revisit higher resistance levels shortly. Given the recent upside strength and growing sentiment in the market, BTC might be heading toward the current all-time high and beyond. Upside Breakout For Bitcoin To New Highs Incoming Crypto expert and […]

XRP has struggled to maintain its momentum in recent weeks, with the token slipping nearly 10% over the past month. At the time of writing, XRP is trading around $2.96, as the broader market shows mixed signals. While assets such as Ethereum continue to post upward moves, establishing a new high, XRP has instead faced consistent correction, leading market participants to closely monitor whether the trend could extend further or stabilize in the near term. A CryptoQuant analyst has noted that XRP’s current price action comes after an early-2025 rally that saw the token reach the $3.5 to $4....
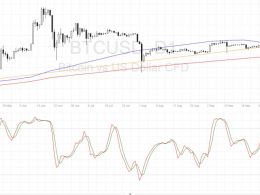
Bitcoin price could be due for more gains after this upside breakout, possibly aiming for the $750 level next. Bitcoin Price Key Highlights. Bitcoin price made a strong upside break of the near-term resistance marked in a previous article. This suggests that bulls are gaining strength and could push price to the next ceiling. At the moment, bitcoin is testing the area of interest at $700, which is a major psychological level. Technical Indicators Signals. The 100 SMA is above the longer-term 200 SMA so the path of least resistance is to the upside, even on this daily chart. However, the....
Solana’s price action is showing fresh signs of strength as bulls reclaim key technical levels. With momentum building around critical support and resistance zones, traders appear to be positioning for the next leg higher. The chart setup suggests renewed upside potential, but overbought signals hint that caution may still be warranted. Solana Breaks Above 200 SMA, Extending Bullish Momentum Gemxbt, a crypto analyst on X, recently highlighted Solana’s strong bullish trend as the asset pushed above the 200-day Simple Moving Average (SMA). This key technical breakout signals renewed strength....
XRP is showing strong signs of a major breakout as momentum continues to build across multiple timeframes. With bullish signals aligning and key structures pointing higher, the market is beginning to price in the possibility of a much larger move, one that could push XRP toward the highly anticipated $10 level if the breakout fully unfolds. RSI Breakout Signals Strength After 1-Year Trendline Crypto analyst JD has pointed to a significant shift in momentum for XRP, noting that the Relative Strength Index (RSI) has officially broken out of a major 1-year trendline on the 3-day chart. While....