
XRP Price Sees Bullish Move, Can Buyers Protect Upside Levels?
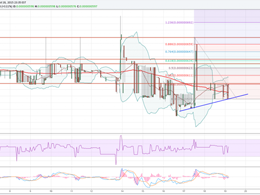
XRP price started a recovery wave from $2.050. The price is now back above $2.25 and might attempt to surpass the $2.420 resistance zone. XRP price was able to start a recovery wave above $2.20. The price is now trading above $2.250 and the 100-hourly Simple Moving Average. There was a break above a bearish trend line with resistance at $2.240 on the hourly chart of the XRP/USD pair (data source from Kraken). The pair could continue to move up if it clears $2.420. XRP Price Starts Recovery XRP price extended losses below $2.25 and $2.20, like Bitcoin and Ethereum. The price dipped below....
Related News
Dogecoin Price Key Highlights. Dogecoin price struggling to gain pace, but there is a chance of it trading higher in the near term. There is a bullish trend line formed on the hourly chart, acting as a support for buyers. Buyers need to clear 60.0 Satoshis for more gains moving ahead. Dogecoin price struggling to hold the ground, but if buyers gain control, an upside move is likely. Trend Line Support. We highlighted recently that there was an upside break above 60.0 Satoshis, which represents a major pivot. However, the price dived one more time to close below the mentioned pivot area.....

Ethereum price surged further higher after a tiny correction, and it looks like the ETH/USD pair is positioning for more gains in the near term. Key Highlights. ETH price after a mild correction against the US Dollar jumped higher to hit the $8.50 level. There is a bullish trend line formed on the hourly chart (data feed via SimpleFX) of ETH/USD, which is likely to act as a support on the downside at $7.90-80. It looks like ETH buyers are now in control and may attempt to take the price further higher. Ethereum Price Upside Surge. ETH price started a nice upside move against the US Dollar....

Ethereum price managed to gain bids one more time against the US Dollar, and currently attempting yet another upside break. Key Highlights. ETH price found buyers near $11.50 against the US Dollar, and started to move higher. During the recent upside move, it broke a bearish trend line formed on the hourly chart (data feed via SimpleFX) of ETH/USD. The pair is also above the 100 hourly simple moving average, which is a positive sign. Ethereum Price Break. Ethereum price fell yesterday back towards the $11.50 versus the US Dollar, but somehow buyers managed to protect the downside move.....

Ethereum price declined further during the past 24 hours to trade as low as $10.97 where the ETH/USD buyers managed to protect the downside. Key Highlights. ETH price jaw dropped versus the US Dollar, and moved below the $11.50 support area. There is a new bearish trend line formed on the hourly chart (data feed via SimpleFX) of ETH/USD, which may stop the current recovery. On the upside, the $11.60-65 levels can now be considered as a major resistance area. Ethereum Price Downside Move. ETH price continued to move down versus the US Dollar, and even traded below the $11.50 support area to....
Ethereum Price Key Highlights. Ethereum price moved higher and managed to settle above a major resistance area of 0.00250BTC. The price is under a bullish pressure, and it is likely that we may witness more upsides in the near term. There is a major bullish trend line formed on the hourly chart, which can be seen as a buying zone. Ethereum price traded higher and it looks set for more gains moving ahead as buyers managed to clear a major hurdle. 0.00250BTC as Support. The Ethereum price gained heavily recently, as sellers failed to take the price below 0.00150BTC. There was a solid upside....