
Bitcoin Bull Run Incoming? This Metric Could Suggest So
On-chain data shows a Bitcoin metric is forming a pattern that may hint that a bull run could be coming next for the asset. Bitcoin HODLer Growth Rate Has Seemingly Reached The “Plateau” Stage In a new post on X, the analyst Charles Edwards shared a chart highlighting a pattern that the BTC “HODLer Growth Rate” indicator may be forming. This indicator keeps track of the 1-year growth in the holdings of the Bitcoin investors who have been keeping their coins dormant (unmoved) in their wallets since at least two years ago. Generally, an investor who holds onto their....
Related News
While digital currency markets have increased significantly in value a number of crypto asset proponents are wondering how far the next bull run will take them. For instance, the last three bitcoin bull runs saw different price spikes and significant drops below 80% as well. If the next bitcoin bull run follows a similar pattern, it’s quite possible the crypto-asset could reach $160k per unit. At the time of publication, the cryptocurrency economy is well above a half of a trillion dollars and is hovering at $538 billion today. The great 2020 crypto price boom has a number of crypto....

CryptoQuant’s Bitcoin Bull Score Index has jumped to a value of 30, indicating bearish conditions persist for the asset, but are no longer as extreme. Bitcoin Bull Score Index Has Seen A Small Uptick In a new post on X, CryptoQuant head of research Julio Moreno has talked about the latest trend in the Bull Score Index for Bitcoin. This indicator basically tells us about the phase of the market that the cryptocurrency is currently in. The metric determines this by referring to the data of ten indicators covering different aspects of the network. Some of the major on-chain indicators....

Bitcoin may be demonstrating a slight rebound from its recent downward trend, which began after it hit a new all-time high, but discussions about a possible cycle top are intensifying within the community. While this discussion is accompanied by speculations about this bull cycle nearing its end, an analyst has highlighted a key metric that […]
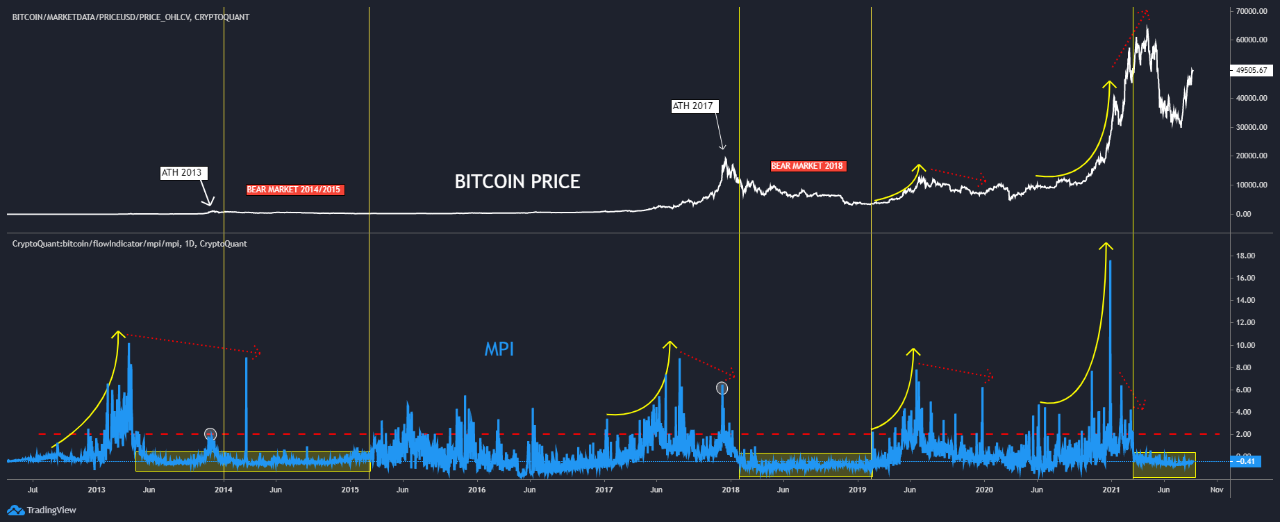
A look at the history of the Miner’s Position Index (MPI) would suggest Bitcoin miners usually sell before the bull run cycle top. The Bitcoin Miner’s Position Index Vs The Price For Various Cycles As pointed out by a crypto analyst on CryptoQuant, the BTC Miner’s Position Index may suggest that miners aren’t good at […]
A quant breaks down how the Bitcoin NUPL indicator may be able to predict the beginning of a new bull run based on past pattern. How The Bitcoin NUPL Metric May Predict The Start Of Bull Run As explained by an analyst in a CryptoQuant post, the various phases of the NUPL indicator may shed some light relating to the bull run status for BTC. The net unrealized profit and loss (or NUPL in short) is a metric that’s defined as the difference between the market cap and the realized cap, divided by the market cap. NUPL = (Market Cap – Realized Cap) ÷ Market Cap In simpler terms, what....