
Bitcoin Mean Reversion Oscillator Prints First Green Oversold Bar in Months –...
Bitcoin continues to struggle around the $90K level as the market battles intense selling pressure and widespread fear. Short-term sentiment remains fragile, with investors reacting to rapid price swings and mounting downside volatility. Yet, beneath the noise, key on-chain metrics are beginning to show signs that the correction may be nearing exhaustion. Related Reading: Nearly 7M Bitcoin Now Sitting At A Loss: Highest Unrealized Pain Since January 2024 According to analyst On-Chain Mind, Bitcoin’s Mean Reversion Oscillator has just printed its first green oversold bar in months, a signal....
Related News

Dogecoin may be lining up for a deeper breakdown even if Bitcoin manages a short-term bounce, according to pseudonymous analyst VisionPulsed, who argues that a familiar 2022-style pattern is re-emerging across majors and memecoins. In a video published December 16, the analyst frames the near-term setup around Bitcoin’s daily stochastic RSI, which is moving from overbought back toward oversold. Over the past two months, every such reset on the daily chart has coincided with fresh lows in price. This time, he says, the structure is slightly different — and that matters for how Dogecoin....
Bitcoin price is in free fall and the cryptocurrency community is in panic. The high-risk, speculative asset class is living up to its notorious volatility and the selling appears unstoppable. At some point, all assets become oversold and recovery begins. After the most recent selloff, BTCUSD weekly RSI has reached the most oversold level in the entire history of price action, including two bear market bottoms. Bitcoin Selloff Sets Record For Most Oversold Weekly RSI Ever Bitcoin price today tapped below $22,000 per coin and is rapidly approaching prices closer to the 2017 peak. Many....
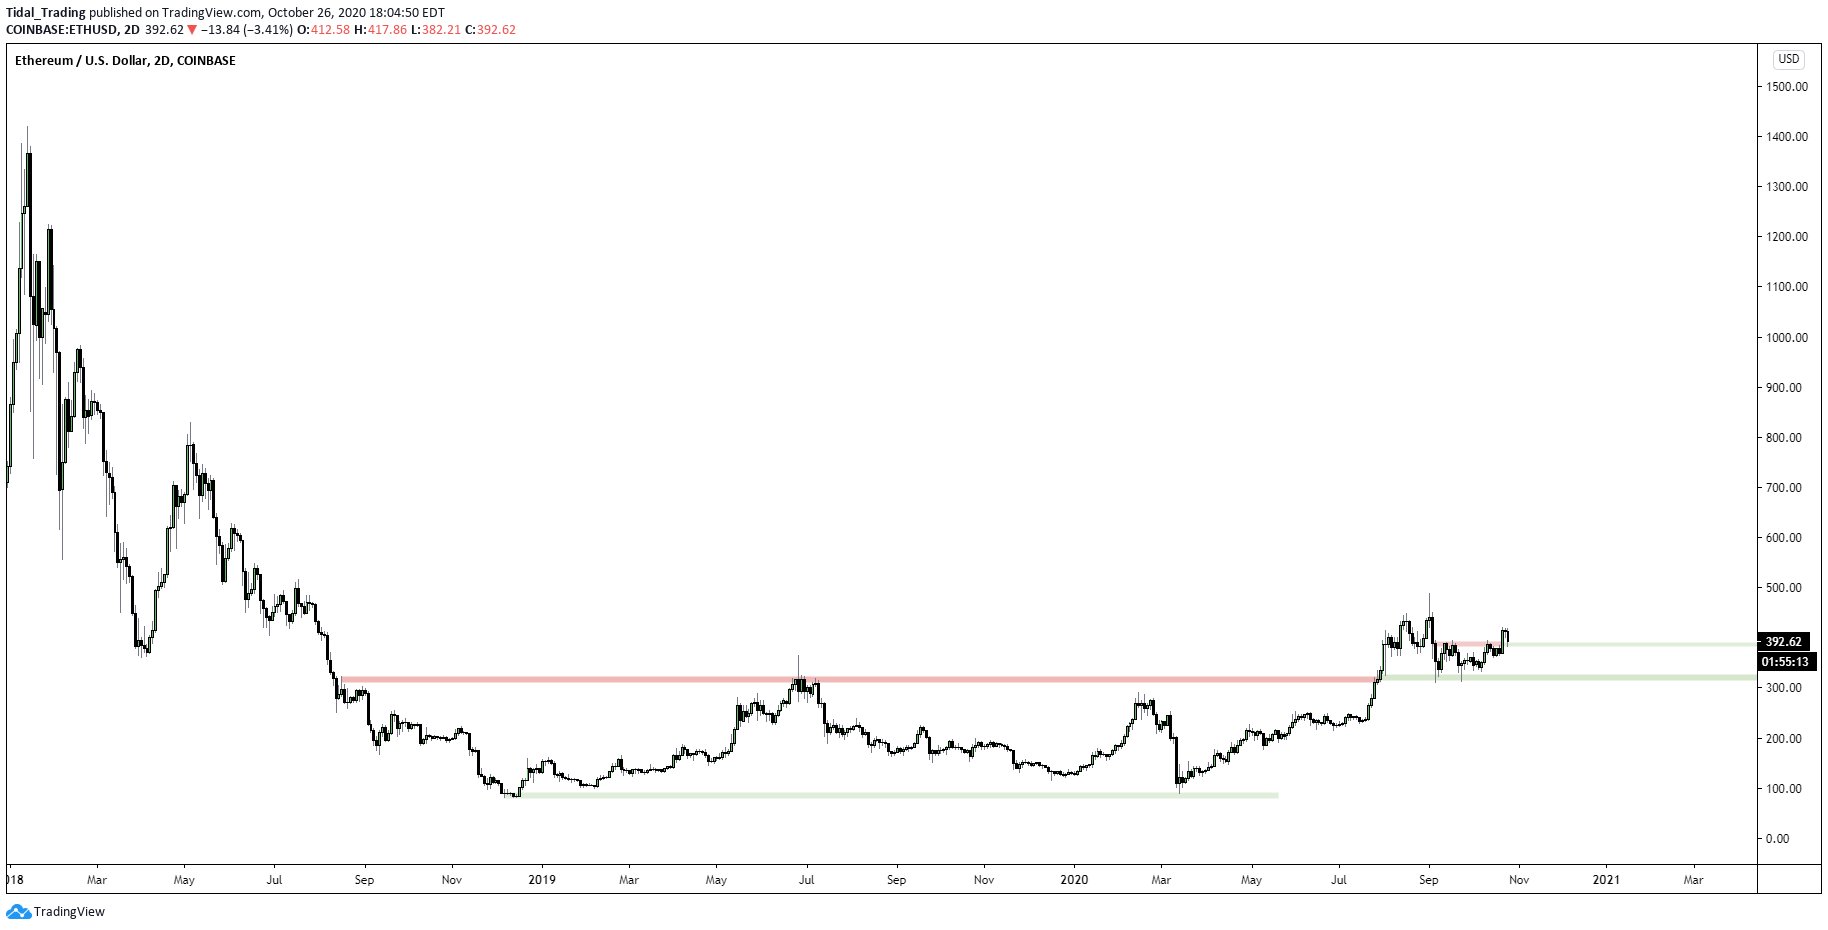
Ethereum is expected to move much higher in the months ahead as the leading cryptocurrency prints a bullish technical signal. Ethereum Bounces Cleanly Off $390 Horizontal Region in Bullish Move As the chart shared below shows, ETH recently bounced off the $380-390 horizontal region, which marks a win for bulls. The chart shows that over the past few months and even stretching into 2018, the high-$300s were an important level for Ethereum to hold. The […]

A $40,000 BTC price provides a classic entry point, the Bitcoin to stablecoin ratio oscillator suggests. MicroStrategy may be as smart as ever “buying the dip” in Bitcoin (BTC) as an indicator with a “perfect” history tells traders to buy.In a tweet on June 15, popular analyst Cole Garner flagged bullish signals for the Bitcoin to stablecoin ratio oscillator.Buy the dip or mind the whale?After MicroStrategy announced plans to raise another $1.5 billion, the proceeds of which could be used entirely to purchase Bitcoin, BTC/USD cemented support at $40,000.The move followed praise from both....
Bitcoin bulls continue to be demoralized, as the price per coin grinds continuously at lows for what feels like an infinite amount of time. However, a bottom could be forming, according to an indicator that has reached historical lows not seen since the 2015 bear market bottom. What followed the last signal, was 10,000% returns and Bitcoin became forever became a household name. While such returns aren’t likely a second time, such oversold conditions could yield some significant, unexpected upside. Here is a closer look at the 3-day Stochastic on BTCUSD price charts. The Stochastic....