
TA: Ethereum Key Indicators Suggest A Sharp Drop Below $1K
Ethereum declined below the $1,120 support against the US Dollar. ETH is now at a risk of more losses if it stays below the key $1,150 resistance. Ethereum remained in a bearish zone below $1,200 and $1,150 levels. The price is now trading below $1,150 and the 100 hourly simple moving average. There is a key bearish trend line forming with resistance near $1,100 on the hourly chart of ETH/USD (data feed via Kraken). The pair could decline further if there is a clear move below the $1,050 support zone. Ethereum Price Turns Red Ethereum remained in a bearish zone and extended losses below....
Related News
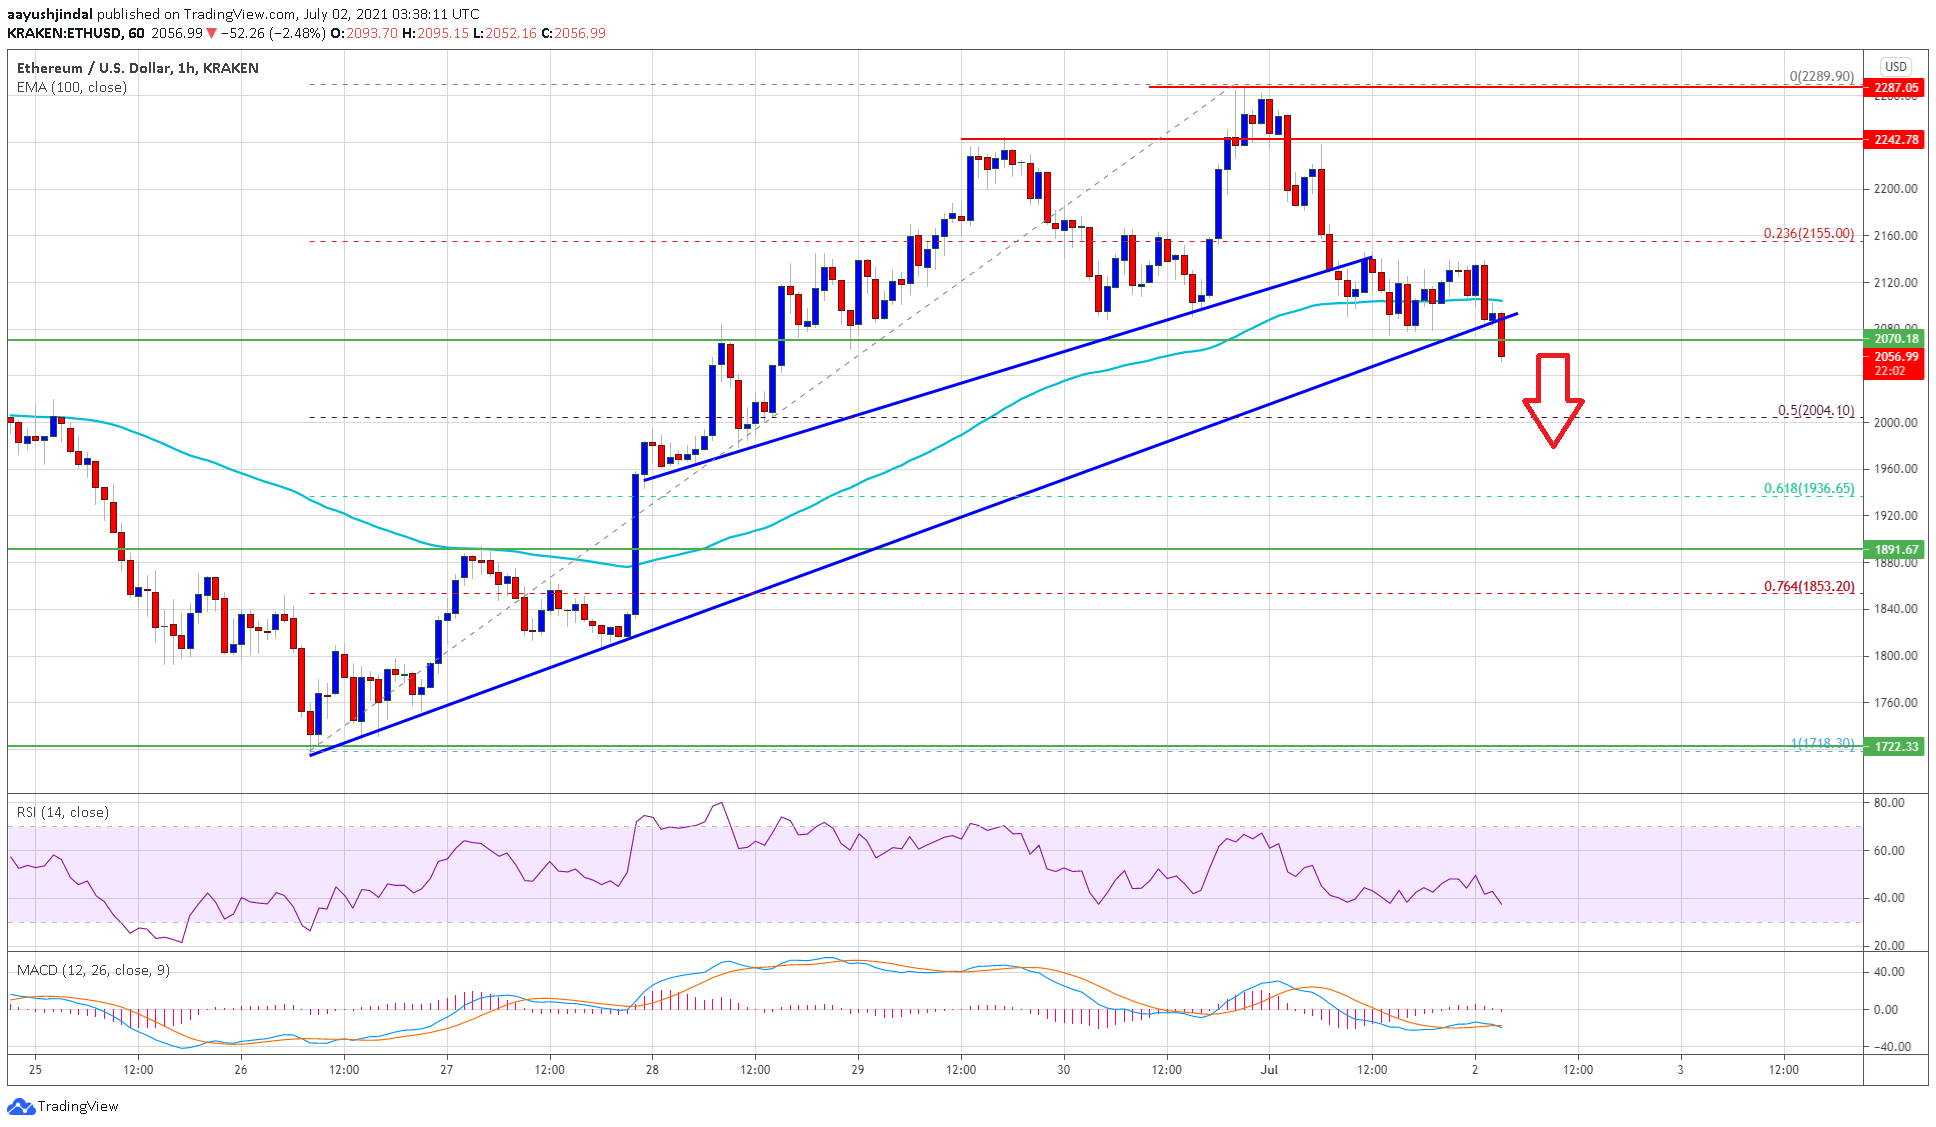
Ethereum failed to stay above $2,100 and it is now moving lower against the US Dollar. ETH price is likely to continue lower and it could even break $2,000. Ethereum started a fresh decline from well above the $2,200 support zone. The price is now trading below $2,100 and the 100 hourly simple moving average. […]

Bitcoin is beginning to show signs of a potential upward trend as several on-chain metrics are turning positive. These metrics, which often serve as indicators of future price movements, paint a picture of growing optimism in the market. One of the key indicators supporting this positive outlook is the exchange inflow/outflow data, which reveals a […]
Bitcoin price is pulling up from its sharp drop but could encounter resistance at the nearby inflection points. Bitcoin Price Key Highlights. Bitcoin price recently made a sharp selloff, breaking below a short-term floor around $620 and bouncing off the $570 area. Bearish momentum could still be in play, although a correction to the broken support seems imminent. Technical indicators are also suggesting that the selloff could resume at some point. Technical Indicators Signals. The 100 SMA is starting to cross below the longer-term 200 SMA to show that the path of least resistance is to the....

Amid the broader decline in the global crypto market, Ethereum emerged as one of the major cryptocurrencies that has been impacted significantly. Despite already being underperformed in the recent bull run, Ethereum has now experienced a notable correction, dropping to as low as below the $3,500 price level in recent weeks. While this price performance from ETH might have led investors to lose interest in Ethereum for now, recent data from the CryptoQuant platform suggests a possible turnaround, with key indicators pointing towards renewed market confidence. Related Reading: Is Ethereum....
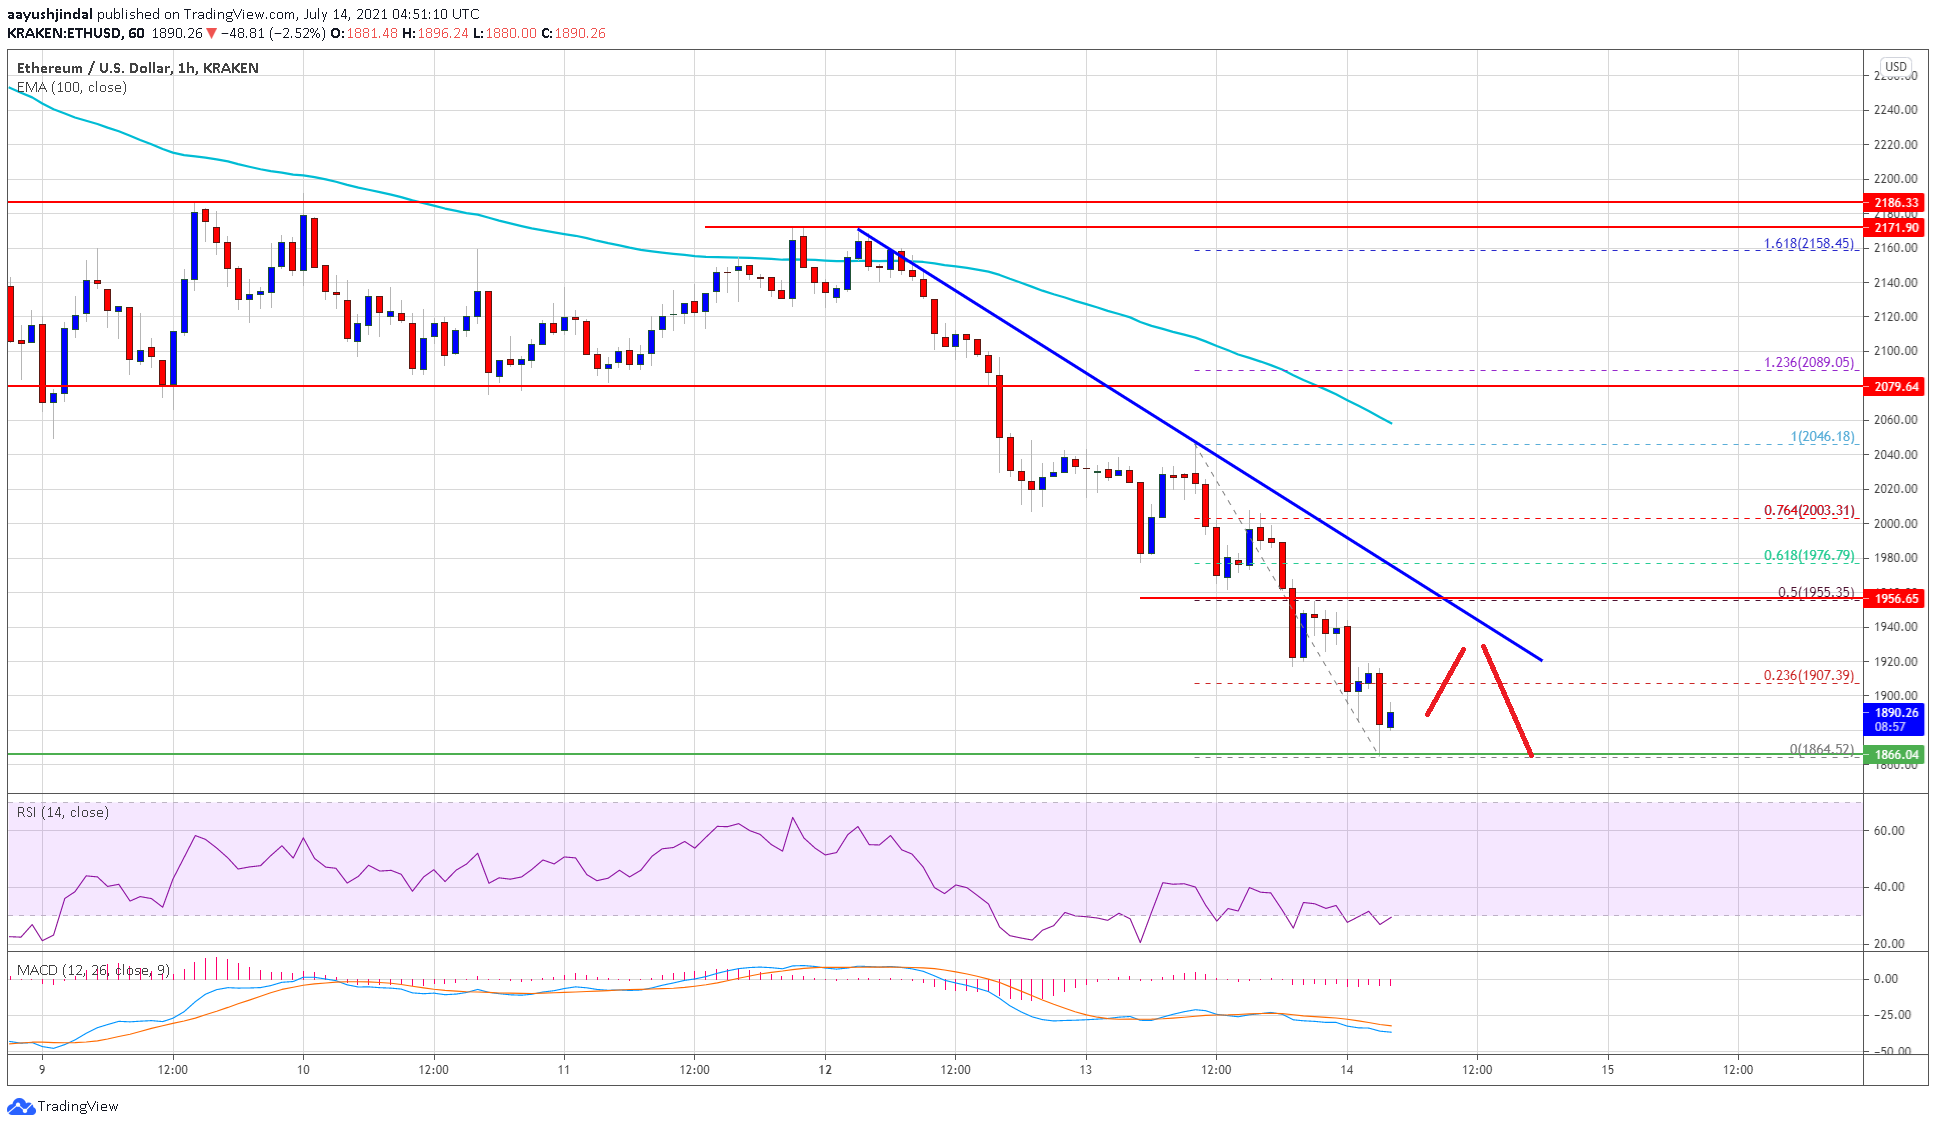
Ethereum declined below the main $2,000 support zone against the US Dollar. ETH price is showing bearish signs and it remains at a risk of more downsides below $1,800. Ethereum extended its decline below the $2,000 and $1,920 levels. The price is now trading well below the $2,000 resistance and the 100 hourly simple moving […]