
XRP Price Still at Risk: Will It Face Another Downside Break?
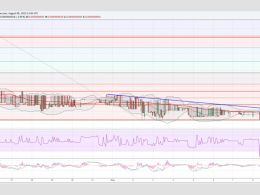
XRP price started another decline after it failed to surpass the $0.530 resistance. The price is back below $0.5150 and showing a few bearish signs. XRP struggled near $0.5300 and started a fresh decline. The price is now trading below $0.5150 and the 100-hourly Simple Moving Average. There was a break below a key contracting triangle with support at $0.520 on the hourly chart of the XRP/USD pair (data source from Kraken). The pair could gain bearish momentum if there is a close below $0.500. XRP Price Turns Red After a steady increase, XRP price faced resistance near the $0.530 zone. A....
Related News
Dogecoin Price Key Highlights. Dogecoin price stayed in a range, but it looks like the price might head lower in the near term. Sellers are making an attempt to break the range low, if it is cleared more losses are likely. 0 Satoshis is a major support area, which must hold if buyers have to prevent the downside. Dogecoin price is at risk of a break lower, as buyers seem to be struggling to prevent the downside. Downside Break. The Dogecoin price stayed in a range throughout this past week, which prevented moves in one particular direction. However, it looks like sellers might be able to....

Key Highlights. Dogecoin price broke an important triangle as forecasted in Yesterday's analysis. Downside momentum was limited, which creates a risk of a false break. 0 Satoshis is an immediate support, which must hold if the recent break is a false one. Dogecoin sellers cleared a critical support, but failed to gain pace, which is a worrying sign in the near term. Downside Continuation Likely. We highlighted atriangle pattern on the hourly chart of Dogecoin Yesterday, which was breached later during the day as forecasted. However, the break was not convincing, as there was no follow....
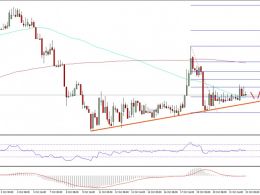
Ethereum price weakened this past week versus the US dollar, and currently waiting for ETH/USD buyers to step in for a recovery. Key Highlights. Ethereum price traded lower against the US Dollar this past week, but remained above a major support. There is a crucial bullish trend line formed on the 4-hours chart of ETH/USD (data feed via SimpleFX), which is acting as a support area. As long as the price is above the trend line support, there is a chance of an upside move. Ethereum Price Correction. Ethereum price ETH was seen struggling throughout this past week against the US Dollar and....
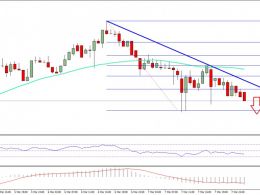
Ethereum price failed to hold the $19.05 support against the US Dollar, increasing the risk of more losses in ETH/USD in the short term. Key Highlights. ETH price remained in a downside category with support at $18.18 against the US Dollar. There is a bearish trend line with resistance at $18.70 formed on the hourly chart of ETH/USD (data feed via SimpleFX). There is a chance that the price may extend the downside leg and trade below $18.18. Ethereum Price Next Leg Lower? Yesterday, we discussed how ETH price may be heading lower vs the US Dollar due to a break below $19.50. The price did....

Ethereum price started a downside correction from $4,250. ETH is moving lower below $4,000 and might decline further if it trades below $3,920. Ethereum started a downside correction below $4,150 and $4,050. The price is trading below $4,050 and the 100-hourly Simple Moving Average. There was a break below a bullish trend line with support at $4,100 on the hourly chart of ETH/USD (data feed via Kraken). The pair could continue to move down if it trades below $3,920. Ethereum Price Starts Downside Correction Ethereum price extended gains above the $4,050 level, like Bitcoin. ETH price even....