Ethereum Price Technical Analysis – ETH/USD Decline Initiated
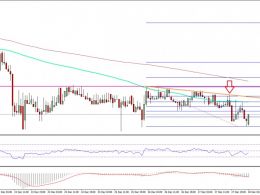
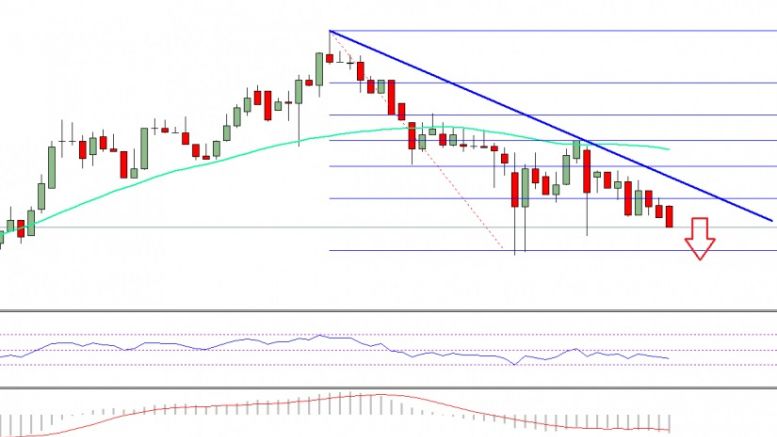
Ethereum price failed to hold the $19.05 support against the US Dollar, increasing the risk of more losses in ETH/USD in the short term. Key Highlights. ETH price remained in a downside category with support at $18.18 against the US Dollar. There is a bearish trend line with resistance at $18.70 formed on the hourly chart of ETH/USD (data feed via SimpleFX). There is a chance that the price may extend the downside leg and trade below $18.18. Ethereum Price Next Leg Lower? Yesterday, we discussed how ETH price may be heading lower vs the US Dollar due to a break below $19.50. The price did....
Related News
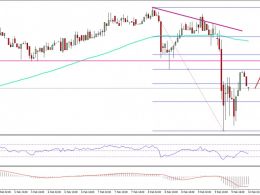
Ethereum price failed to gain momentum against the US Dollar, and failed near $7.20. More losses are likely in ETH/USD moving ahead? Key Highlights. ETH price started a correction wave yesterday against the US Dollar, but it looks it failed to gain traction. There is a new minor bearish trend line formed on the hourly chart (data feed via SimpleFX) of ETH/USD, which is currently acting as a resistance. The price is back trading near the last swing low of $6.87, and remains at risk. Ethereum Price Decline. Yesterday, there was a correction wave initiated in ETH price against the US Dollar.....
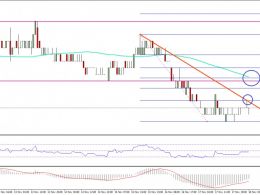
Ethereum price declined sharply as two Bitcoin exchanges in China suspended withdrawals. ETH/USD is under heavy pressure, and may decline further. Key Highlights. ETH price after initiating a break yesterday at $11.30 against the US Dollar started a downtrend. Yesterday’s highlighted bearish trend line on the hourly chart of ETH/USD (data feed via SimpleFX) acted as a barrier at $11.20 and pushed the price down. The price traded sharply lower, and also broke the last swing low at $10.80. Ethereum Price Decline Initiated. Yesterday, there were signs of a downtrend in ETH price against the....
Ethereum classic price remained under the bearish pressure, and the downside pressure initiated yesterday got more traction intraday. Key Highlights. Ethereum classic price extended its downside move, which was initiated yesterday against the Bitcoin. Yesterday’s highlighted bearish trend line on the hourly chart (data feed via Simplefx) of ETC/BTC, acting as a resistance area. On the downside, the recent low of 0.00112BTC may act as a support area in the short term. Ethereum Classic Price Decline. I highlighted in yesterday’s post how a bearish trend was initiated for ETC price versus the....
Ethereum price started a substantial correction yesterday against the US Dollar, and it looks like ETH/USD may trade towards $10.20 in the short term. Key Highlights. ETH price started a correction after trading as high as $10.84 against the US Dollar. There is a bearish trend line formed on the hourly chart (data feed via SimpleFX) of ETH/USD, which is pushing the price down with resistance near $10.55. The pair has also moved below the 100 hourly simple moving average at $10.54, which is a bearish sign. Ethereum Price Correction. Yesterday, I highlighted the start of a correction in ETH....
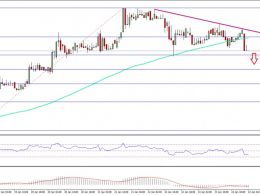
Ethereum price after trading a few points above $11.20 struggled against the US Dollar, and now ETH/USD has started a correction wave. Key Highlights. ETH price after a nice upside move against the US Dollar found resistance near $11.22, and started a correction. There is a descending channel pattern formed on the hourly chart of ETH/USD (data feed via SimpleFX), which is acting as a downside move catalyst. The price may dip towards $10.90 before gaining bids once again for an upside move. Ethereum Price Trend. There was a nice uptrend initiated in ETH price against the US Dollar, as there....

