
XRP Sends Bullish On-Chain Signal Despite Weak Price Action
XRP is showing signs of on-chain stabilization despite trading below the average holder cost basis, according to data by Alphractal. The data points to a market still under pressure, but one where network activity, exchange supply and leverage conditions do not resemble a panic-driven breakdown. Alphractal’s asset overview places XRP’s spot price at $1.4343, below its realized price of $1.4862. That gap matters because realized price reflects the average on-chain acquisition cost across circulating XRP. With spot price below that level, the average holder is sitting on an unrealized loss.....
Related News

According to a recent post on X by crypto analyst Crypto Rover, the Bitcoin (BTC) Rainbow Chart is flashing a buy signal, suggesting that the leading cryptocurrency may be on the cusp of a significant upward move. However, weak market demand could pose a risk to this bullish momentum. Bitcoin Rainbow Chart Flashes Buy Signal […]

Retail sentiment toward Ethereum (ETH) remains weak, but analysts suggest that a significant breakout could be on the horizon. Despite Ethereum’s sluggish price action, multiple on-chain indicators and technical patterns hint at an impending bullish reversal. Ethereum Retail Sentiment At Low Amid Sluggish Price Action According to cryptocurrency analyst Mister Crypto, retail interest in ETH is “extremely low,” as indicated by Google Trends data. Compared to its 2017 and 2021 peaks, Ethereum’s current sentiment ranks significantly lower, suggesting that many retail investors are sitting on....
A crypto market expert has reported that Bitcoin (BTC) has just formed its most bullish signal amid the ongoing bear market trend. According to the analyst, this technical signal could be the catalyst for a major bullish turnaround, potentially propelling Bitcoin’s price to explosive levels. Analyst Reveals Bitcoin’s Most Bullish Signal Yet The Bitcoin price […]
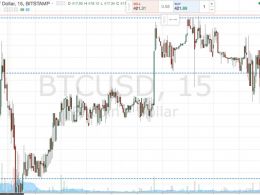
Here's what we are looking at for the evening session in the bitcoin price on Monday. Before we get going on this evening’s bitcoin price analysis, take a quick look at the chart below. It’s a fifteen-minute candlestick chart that shows the action seen in the bitcoin price over the weekend, and this morning, with today’s framework overlaid. As the chart shows, the range we were looking at this morning was defined by in term support at 418 flat and in term resistance at 422. We went into the session with a breakout focus – that is, our range wasn’t wide enough to bring intrarange to the....
As market volatility sends Dogecoin (DOGE) to retest its breakout level, some analysts have advised “cautious” optimism for the leading memecoin, arguing that weak bullish momentum could invalidate the recent price action. Related Reading: SUI Eyes Price Recovery As Institutional Exposure Expands With Grayscale, Canary ETF Launches ‘Optimism With A Seatbelt On’ On Thursday, Dogecoin fell to a one-week low of $0.095 before bouncing back above the $0.098 support level. The cryptocurrency has been hovering between $0.096 and $0.104 for the past six days, briefly reaching a multi-week high of....