
Polkadot Price Caught In A 5-Year Channel – Can It Finally Break Free?
According to Çağnur Cessur in a recent post on X, Polkadot (DOT) has been consistently trading within a clearly defined black channel on the monthly chart. This channel is formed by well-established horizontal support and resistance levels, which have been tested numerous times over the past 4 to 5 years. The range, spanning from $4 on the lower end to around $12 at the top, has effectively boxed in DOT’s price action, shaping a long-term sideways market structure. A clear move beyond this 5-year range, especially on strong volume, could mark the beginning of a new trend, either into....
Related News

Polkadot price has steadied itself above the $8 price mark. The coin seems to be extending the price recovery as DOT looks at moving past its next price ceiling. It also formed a bullish pattern on its daily chart. The cup and handle pattern that Polkadot has been forming for the past two months indicate that the bulls were strong in the market. The cup and handle pattern usually indicates a bullish continuation of price. Over the past week, Polkadot price surged over 24% marking strong recovery. DOT has been among the highest gainer within the top 10 cryptocurrencies based on market cap.....
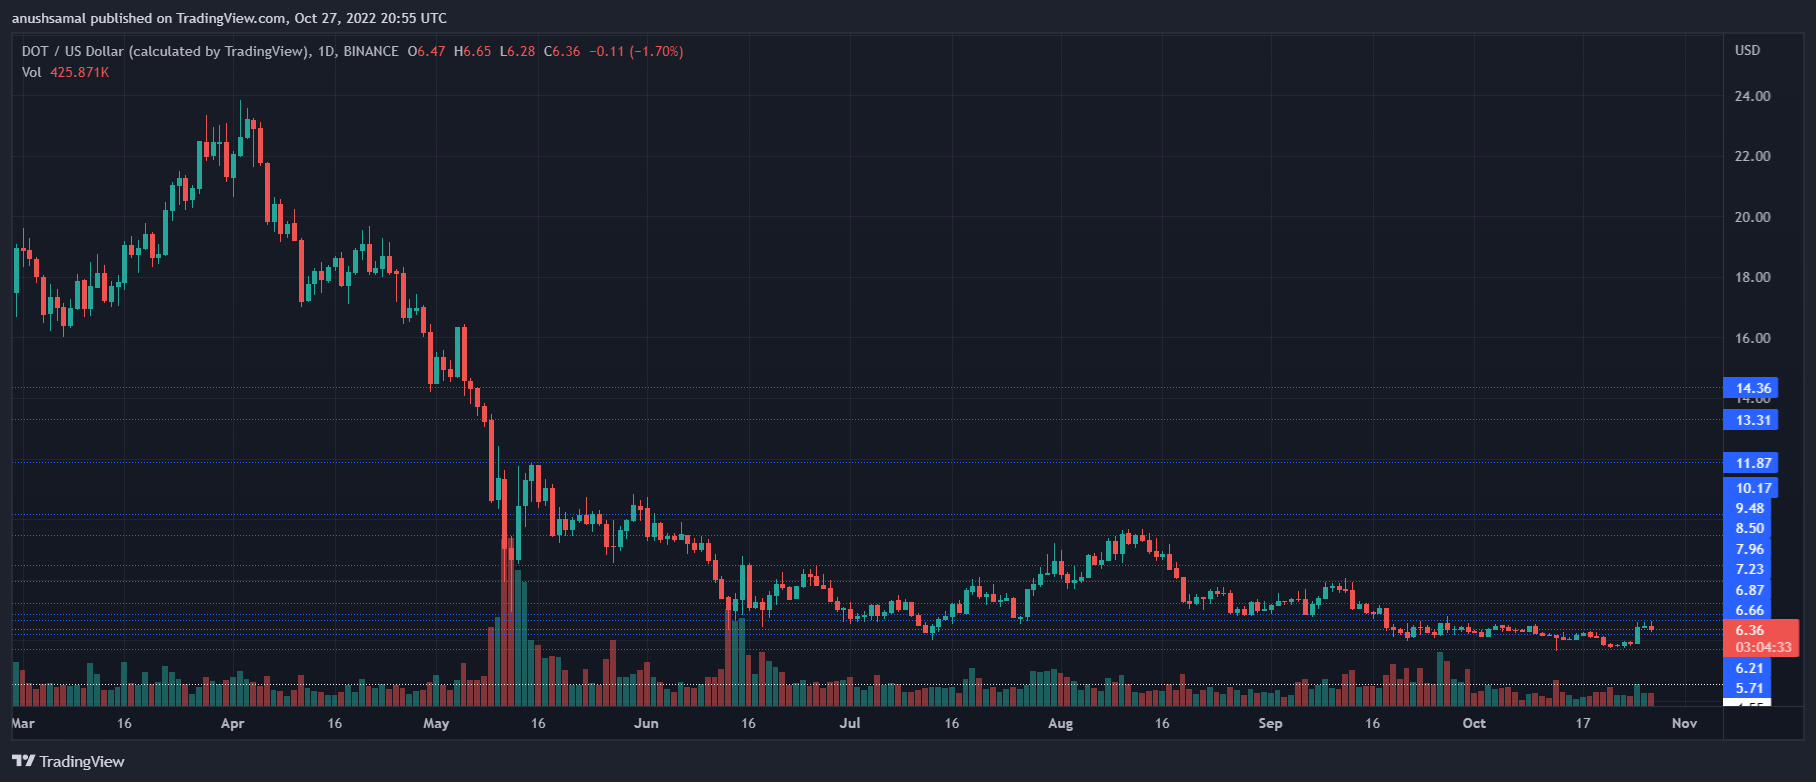
Polkadot price has retraced on its chart over the last 24 hours. The coin has started to register sideways movement on its one-day chart. During this period, the coin lost close to 2% of its market value. In the last week, DOT registered more than 6% appreciation, which caused the bulls to gain stamina and break past the consolidation phase. The technical outlook for the coin remained positive; however, the indicators indicated that the bullish momentum was fading off the charts. Bitcoin also retraced slightly on its chart. Many altcoins have also started to trade sideways following....
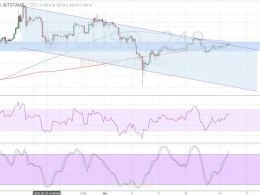
Bitcoin price is testing the channel resistance once more, still deciding whether to make a bounce or a breakout. The 100 SMA is still above the 200 SMA for now with a downward crossover looming. If that happens, more sellers could join the fold and increase bearish pressure enough to lead to a drop until the channel support near $380. RSI is heading north so buyers are still in control but the oscillator is nearing the overbought levels. Stochastic is also heading up and approaching the overbought zone, which could mean that buyers are getting exhausted and ready to let sellers take over.....
Polkadot (DOT) prices have declined by 4.38% in the past day as bearish forces continue to gain stronger market control. According to data from CoinMarketCap, DOT’s price fall only underlines the asset’s form in recent days as indicated by the 7.99% loss in the last week. However, market analyst Ali Martinez postulates that this downtrend could soon result in something positive. Related Reading: Polkadot Price Crisis: Further Losses Incoming After DOT Falls Under $4.8 Polkadot Approaches Key Support — Can DOT Hold And Rebound To $10.80? Following the intense price volatility....

What a year for Polkadot, not only has its DOT token now crossed the all-time high, to trade at $30.22, it is also up 938% in the last year (15th feb 202-16th Feb 2021). If you had invested just $1000 one year ago on DOT, you would now have $9380. Not to be sniffed at. But this all pales into insignificance when you look at the bigger picture and the latest Polkadot news, which they […]