
“This Is It”: Bitcoin Is Undergoing a Critical Breakout After Consolidation
Bitcoin has moved much higher over the past two days after many weeks of consolidation. Throughout most of September, the cryptocurrency traded snug between $10,000 and $11,000. As of this article’s writing, the coin has moved up to $11,050 as it breaks higher on fundamental and technical trends. For one, the U.S. dollar is plunging as stimulus talks have seemingly restarted in a manner that should boost alternative assets. Analysts think that this may be […]
Related News

XRP is showing signs of calm, but the underlying structure tells a different story. Following a major breakout, the price has shifted into a tight consolidation range, often a precursor to powerful expansion moves. With key support levels holding and momentum quietly building, the stage appears set for a breakout that could catch many off guard. XRP Breaks Free: Multi-Year Compression Finally Gives Way EGRAG CRYPTO highlighted a major structural shift in XRP that many market participants may be overlooking. According to the analyst, XRP has broken out of a multi-year compression phase....
The XRP price is once again making headlines as technical indicators show a solid breakout after months of consolidation. With its recent break in tight price action, a crypto analyst believes that XRP could be preparing to surge above $8, marking a new ATH for the top altcoin. XRP Price Aims For $8 Target In Coming Months After months of constrained price action, the XRP price has finally broken out of a descending consolidation pattern—a bullish signal that the market has been eagerly awaiting. Following this breakout, XRP is now eyeing a potential rally toward the $8.08 mark. Related....
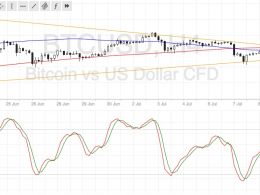
Bitcoin price is still stuck in consolidation but might be ready to make a strong breakout in either direction sooner or later. Bitcoin Price Key Highlights. Bitcoin price formed higher lows and lower highs, creating a symmetrical triangle pattern on its 4-hour time frame. Price is still stuck inside that triangle pattern for now but a breakout might be due since it is approaching its peak. A breakout in either direction could set the longer-term trend for bitcoin. Technical Indicators Signals. The 100 SMA is currently below the 200 SMA, signaling that the path of least resistance is to....
Key Highlights. Dogecoin price continued to trade in a range, and looks set for a near-term breakout. 66.0 Satoshis is turning out be a major support area for Dogecoin. A critical breakout pattern is formed on the hourly chart, which might ignite swing moves in the short term. Dogecoin price settled below an important support of 70 Satoshis, signaling that buyers failed to capitalize and might struggle moving ahead. Triangle Breakout Pattern. There was a consolidation phase noted for the Dogecoin price within a contracting range, which resulted in a breakout pattern formation. There is a....
XRP remains in a holding pattern, according to the latest chart analysis shared by crypto analyst @CasiTrades. Despite a relatively subdued weekend, XRP continues to trade above critical support levels, indicating that the current bullish structure has not been invalidated. XRP Price Remains Bullish A closer look at the 4-hour XRP/USD chart by @CasiTrades shows two converging trend lines that have formed a symmetrical triangle spanning from mid-January to mid-March. XRP’s price action has respected both the upper and lower boundaries of this formation until early March. Related Reading:....