Bitcoin Forming A Signal That’s Usually “Very Bullish,” Analyst Says
An analyst has pointed out how Bitcoin is back above the cost basis of the short-term holders, a sign that can be bullish for the asset. Bitcoin Is Back Above The Realized Price Of Short-Term Holders As explained by CryptoQuant community manager Maartunn in a new post on X, BTC has reclaimed the Realized Price of the short-term holders. The “Realized Price” here refers to an indicator that, in short, keeps track of the average cost basis of the investors in the Bitcoin market. When the value of this metric is greater than the cryptocurrency’s spot price, the average....
Related News
On-chain data shows the Dogecoin whales have gone on a buying spree while the memecoin’s price has declined in the last 24 hours. Dogecoin Whales Have Increased Their Holdings During The Past Day As pointed out by analyst Ali Martinez in a post on X, the Dogecoin whales have participated in net accumulation in the last 24 hours. The on-chain metric of relevance here is the “Supply Distribution” from the analytics firm Santiment which tells us about the amount of DOGE that a given wallet group is currently holding. Related Reading: Bitcoin Forming A Signal That’s Usually....
Bitcoin whales are buying again, and that’s rarely a quiet signal. Large holders are scooping up $BTC at levels not seen since the last bull market, while mid-sized wallets are finally flipping bullish too. Add to that a bold prediction from crypto analyst Benjamin Cowen – who sees a potential 137% upside for Bitcoin in […]
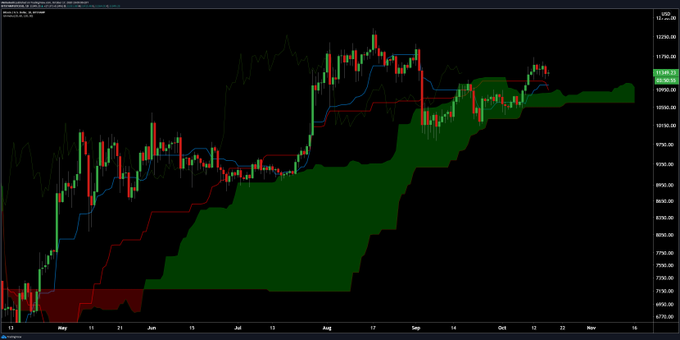
Bitcoin is forming a pivotal buying signal after weeks of consolidation. The cryptocurrency pushed higher over the past 10 days, which allowed this indicator to trend higher to form the buying signal seen today. Bitcoin Prints Pivotal Ichimoku Cloud Crossover Josh Olszewicz, a crypto-asset analyst, recently noted that the cryptocurrency formed a bullish TK Cross as per the Ichimoku Cloud indicator. The indicator is a multi-faceted indicator that shows important price levels along with the […]
An analyst has pointed out how Chainlink is forming a TD Sequential sell signal right now, which could lead to a retracement to this level. Chainlink Could Decline To $12.50 Following The Sell Signal As explained by analyst Ali in a new post on X, LINK could be heading toward a correction based on what the TD Sequential signal says. The “Tom Demark (TD) Sequential” is a popular indicator in technical analysis that is used to pinpoint reversals in the price of any asset (which, in the current discussion, is naturally Chainlink). The metric gives a signal whenever the asset has....
The XRP price fell as low as $2.0238 on Monday, potentially forming a local bottom. Since then, the XRP price is up almost 6%, however, the possibility of a deeper retracement remains. Two prominent chartists—CasiTrades (@CasiTrades) and Charting Guy (@ChartingGuy)—have shared their perspectives on whether the token has found its local bottom or if further downside might still be on the table. Is The XRP Price Bottom In? According to CasiTrades’ newly published chart, XRP appears to have tested the 0.786 Fibonacci retracement at $2.05 and is now showing bullish divergences across multiple....


