
As Bitcoin Breaks $50k, Indicators Look Similar To The Rally That Lead To ATH
As Bitcoin finally breaks $50k, on-chain data shows BTC indicators look similar to the rally that lead to the ATH earlier in the year. Bitcoin Indicators May Suggest A Repeat Of The ATH Rally From Earlier In 2021 As pointed out by a CryptoQuant post, the derivative exchanges’ reserve has been going down, while the funding rate has been turning slightly positive. This means these indicators are now gradually recovering from the May crash, and the trends at the moment look similar to the pre-bull run buildup. The derivatives exchanges‘ reserve is an indicator that shows the total....
Related News

As Bitcoin retests the $50k price level, on-chain indicators seem to be aligned so that they suggest the coin might explode upwards soon. Bitcoin Indicators May Be Showing A Calm Before The Storm As pointed out by a CryptoQuant post, Bitcoin indicators seem to be showing some interesting values right now. Some of these even look similar to the build up to the late 2020/early 2021 rally that lead to the all-time-high (ATH). Here is a quick explanation (along with the data) of the three relevant metrics the chart talks about: The transactions count indicator shows the average number of....

Bitcoin's rally is still going as investors continue to accumulate the cryptocurrency, ignoring overbought signals on technical indicators.
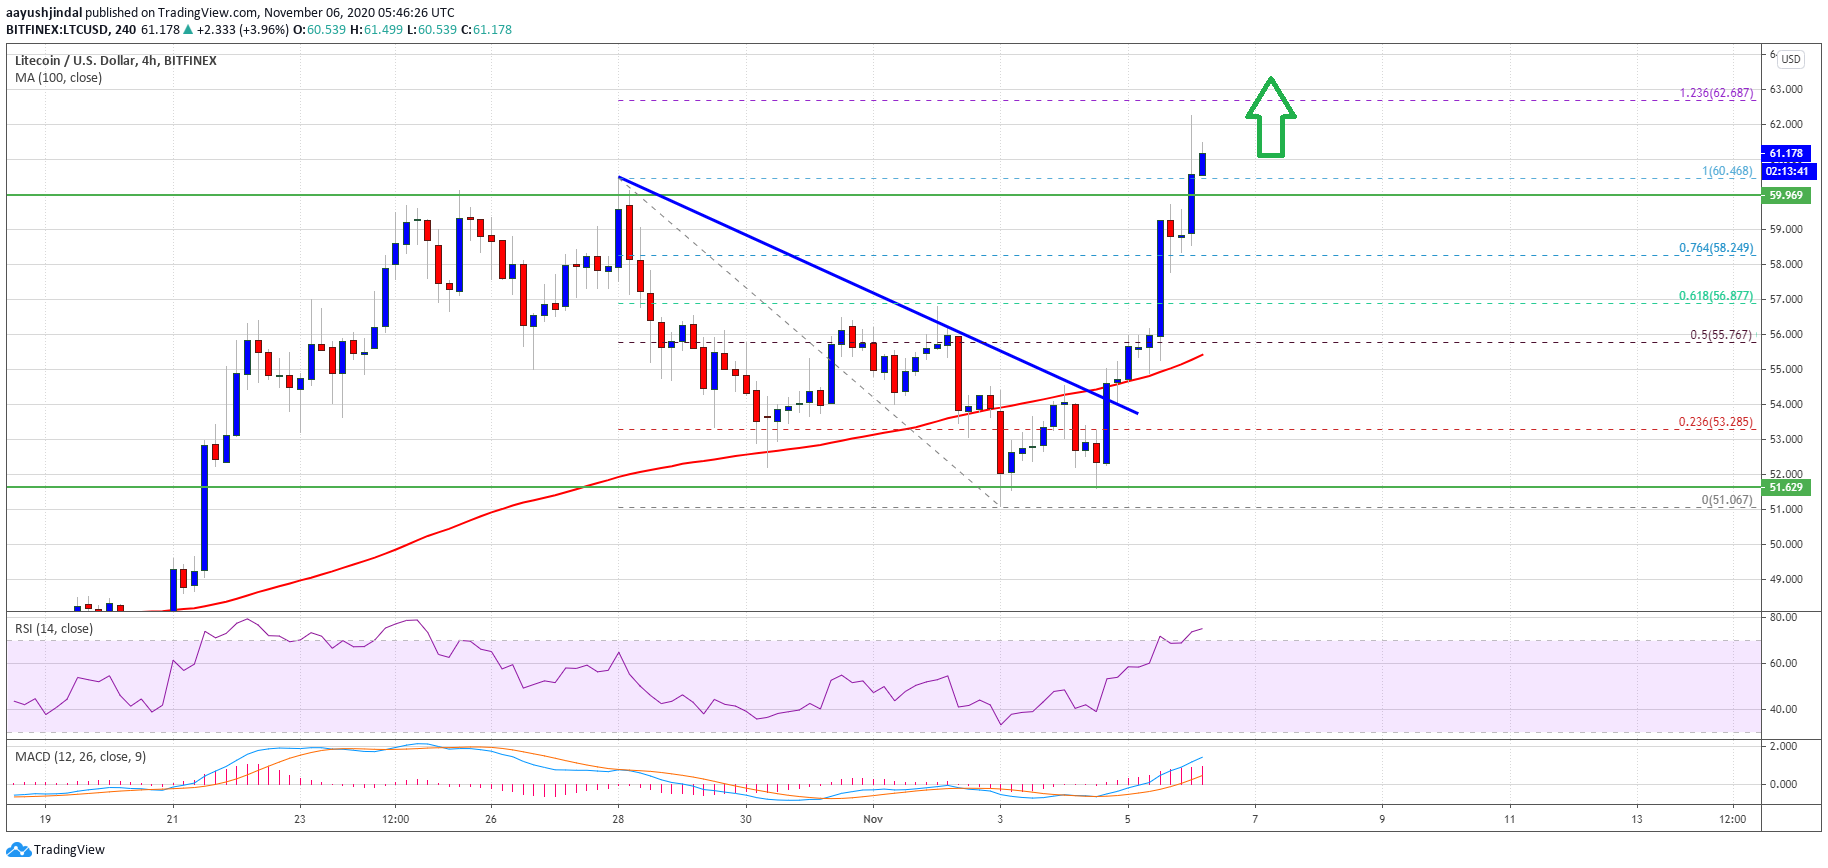
Litecoin price is gaining momentum above $60.00 against the US Dollar. LTC is likely to continue higher (similar to bitcoin) towards $70.00 or $75.00 in the near term. Litecoin started a strong rally above the $55.50 and $58.00 resistance levels against the US Dollar. The price is now trading nicely above the $60.00 level and […]

After experiencing months of slow action, the Cardano price is now flashing major bullish signals as it approaches a critical breakout level. Citing historical patterns and recent chart formations, a crypto analyst predicts that Cardano could rally by a staggering 300% if it successfully breaks through key resistance levels. Cardano Price Poised For 300% Rally […]
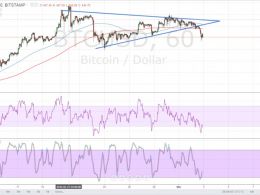
Bitcoin price could be due for more declines after making a downside break of consolidation and forming a reversal pattern. Technical indicators are suggesting a potential bounce for now, with the 100 SMA above the 200 SMA and oscillators moving out of the oversold levels. Both RSI and stochastic are also showing slight bullish divergences, hinting that buyers could come back in the game and trigger a pullback or rally for bitcoin price. A pullback could lead to a test of the broken triangle support near $430 and the moving averages, which might hold as dynamic inflection points. A larger....