TA: Bitcoin Prints Bearish Pattern, Why BTC Could Drop To $42K
Bitcoin extended decline below the $45,000 support against the US Dollar. BTC remains at a risk of a move towards the $42,000 support zone. Bitcoin gained bearish momentum after it broke the $45,000 support zone. The price is trading below $45,000 and the 100 hourly simple moving average. There are two bearish trend lines forming with resistance near $43,900 and $46,400 on the hourly chart of the BTC/USD pair (data feed from Kraken). The pair could extend decline towards the $42,000 level in the near term. Bitcoin Price Dives Over 5% Bitcoin price started a major decline from the $47,000....
Related News
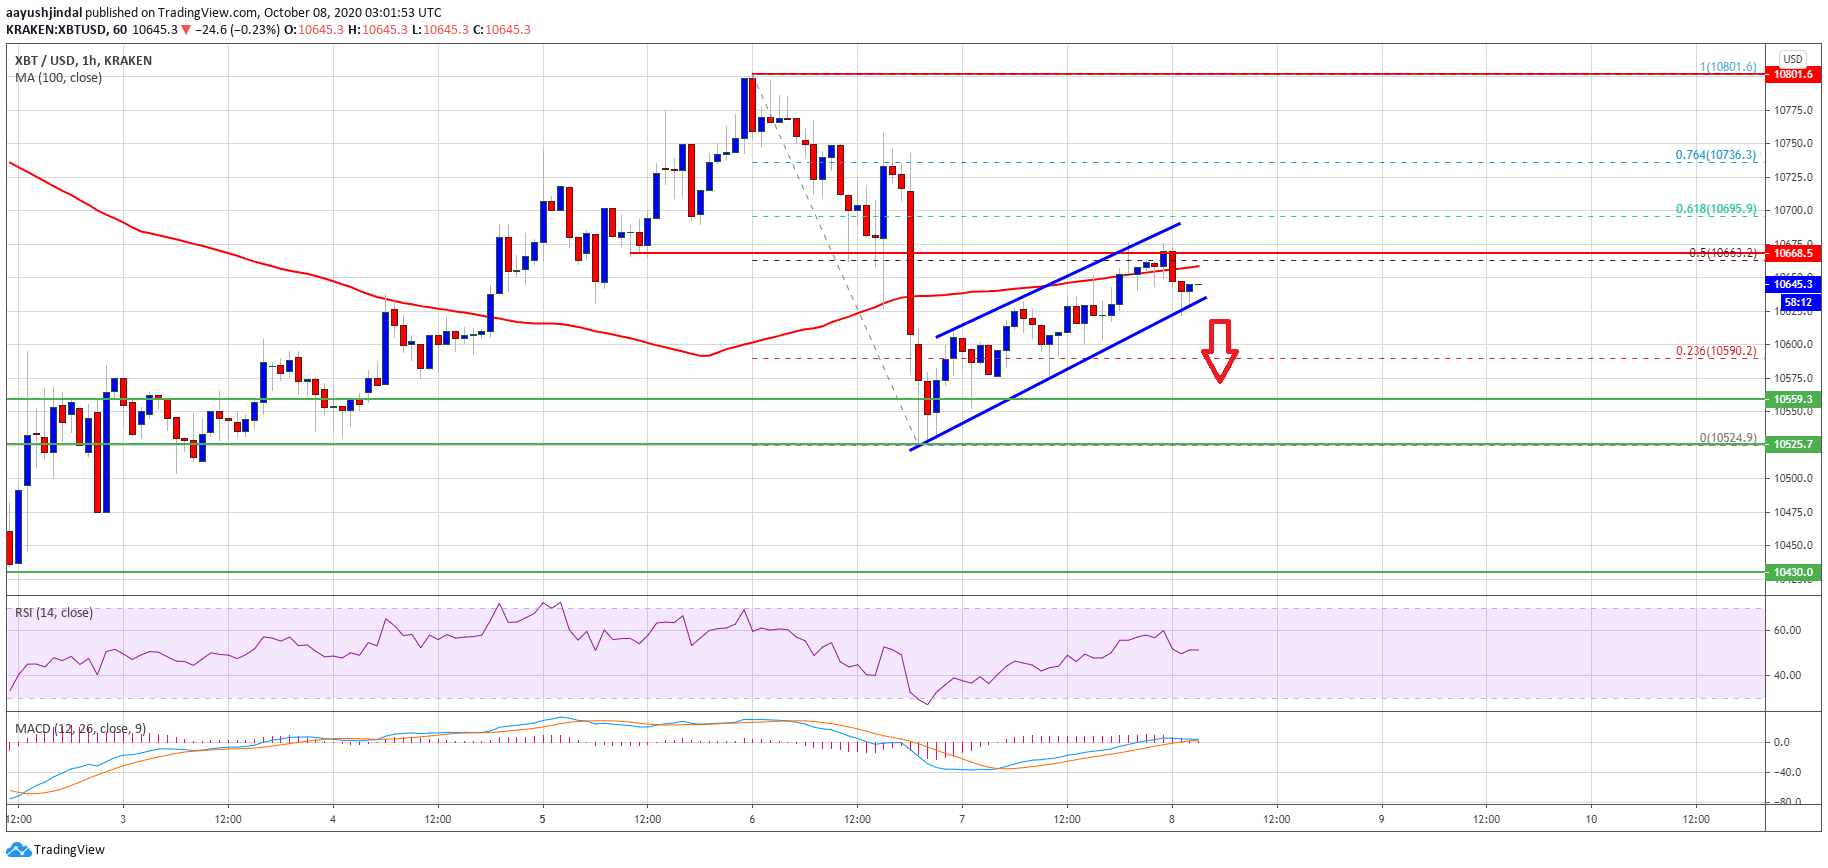
Bitcoin price is currently correcting higher from the $10,550 support against the US Dollar. BTC is currently facing hurdles and it is likely to resume its decline below $10,550. Bitcoin is showing many bearish signs below the $10,800 resistance zone. The price is now trading below the $10,675 resistance and the 100 hourly simple moving […]
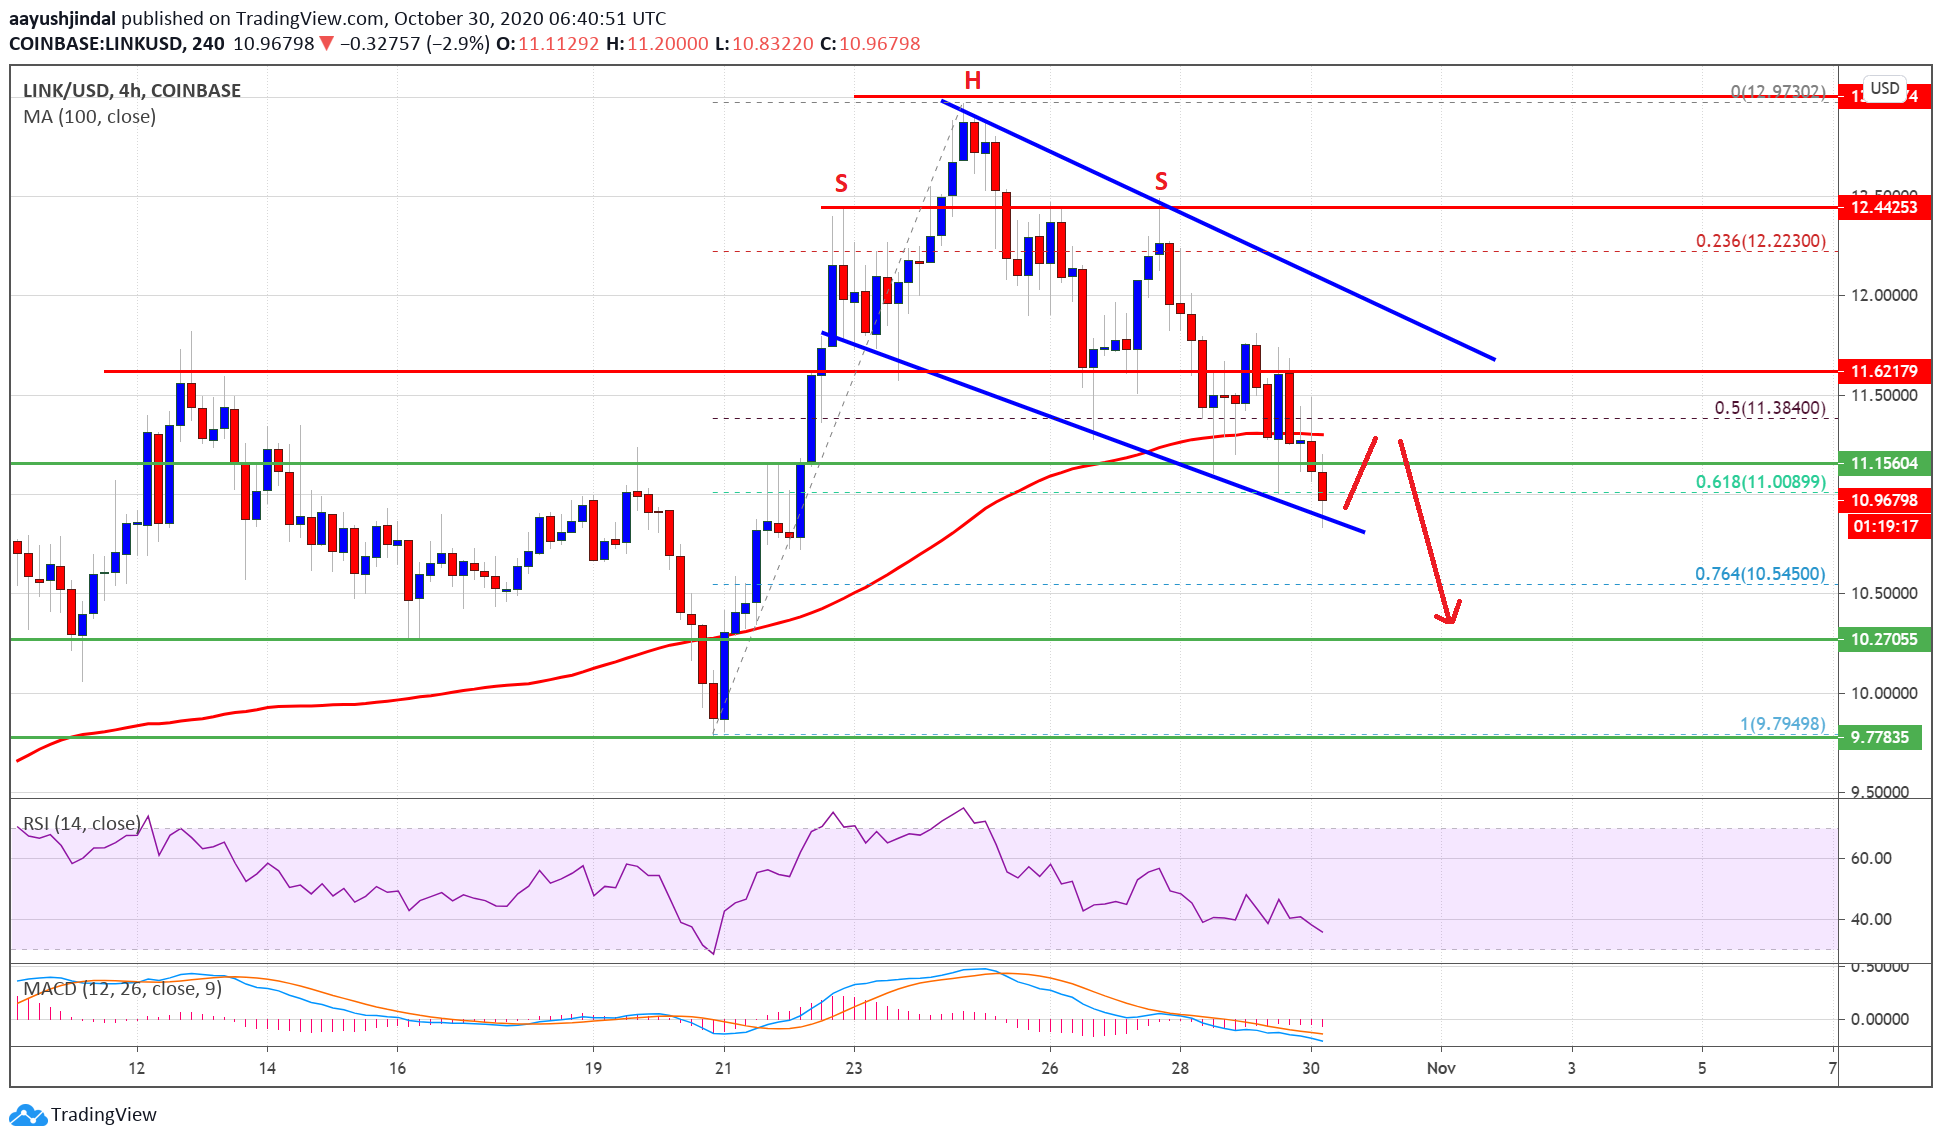
Chainlink (LINK) started a sharp decline after forming a head and shoulders pattern (as discussed in the previous analysis). The bears are gaining strength and aiming a test of $10.20. Chainlink token price started a fresh decline after it failed to clear the $12.50 resistance against the US dollar. The price is now trading below […]
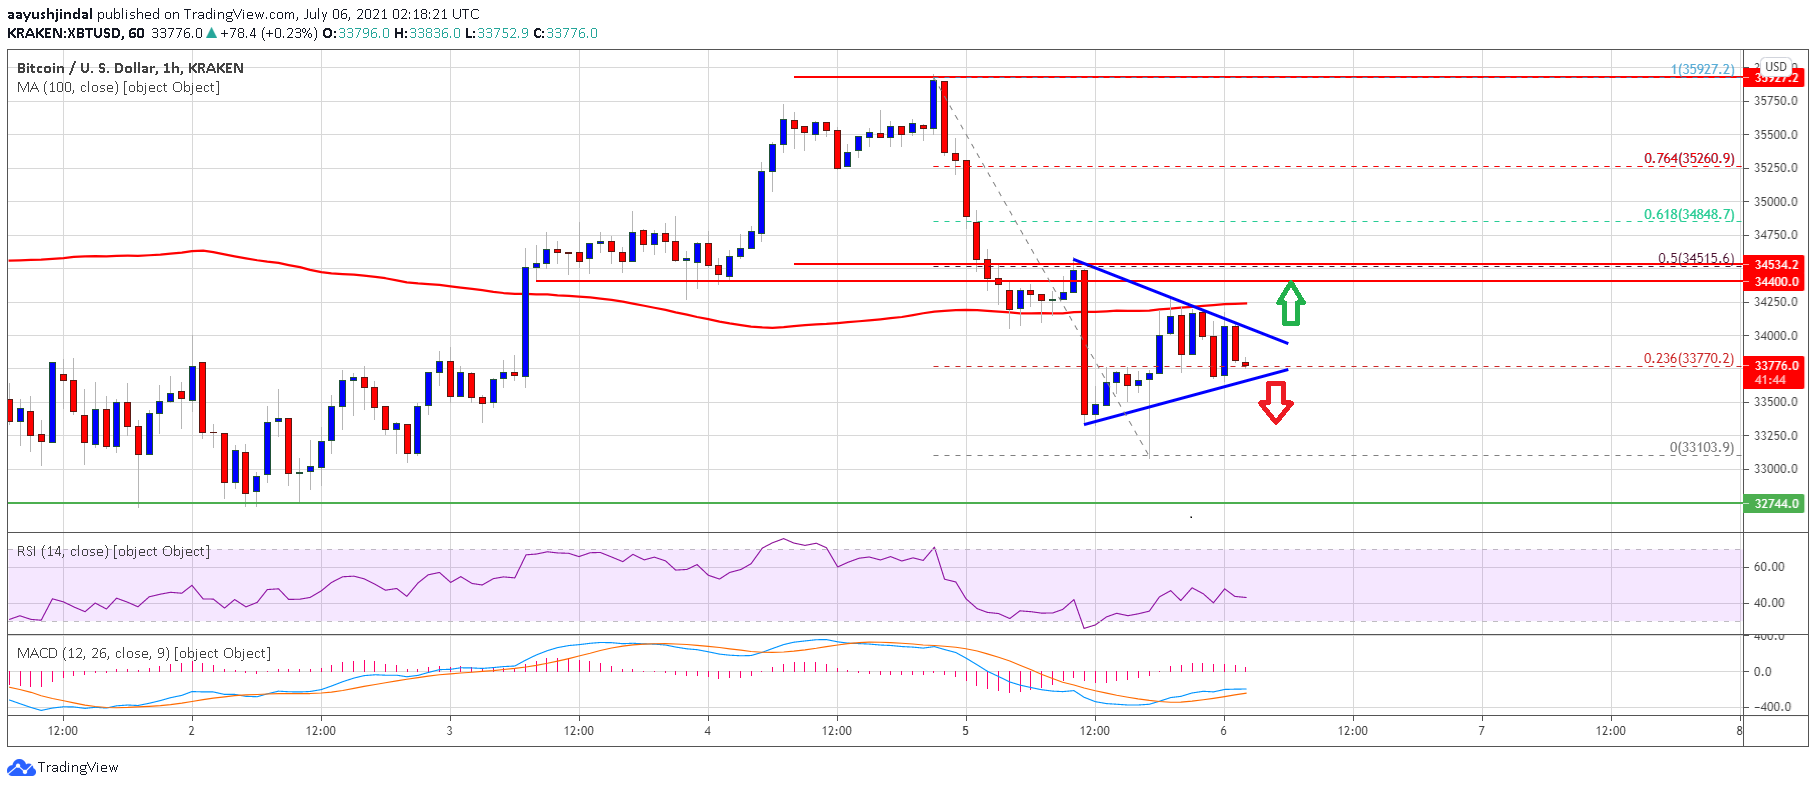
Bitcoin price is correcting gains and it is trading well below $35,000 against the US Dollar. BTC could decline further if it stays below $34,400. Bitcoin started a downside correction below the $35,000 and $34,000 levels. The price is now trading below the $34,000 support and the 100 hourly simple moving average. There is a […]
Ethereum failed to recover above the $3,120 pivot zone against the US Dollar. ETH price is declining and it could extend its losses below $2,950. Ethereum struggled to recover above the $3,120 and $3,125 resistance levels. The price is now trading below $3,080 and the 100 hourly simple moving average. There is a major bearish trend line forming with resistance near $3,150 on the hourly chart of ETH/USD (data feed via Kraken). The pair could accelerate lower if there is a close below the $2,950 low. Ethereum Price Remains At Risk Ethereum started an upside correction from the $2,950 low,....
Ethereum is having a good week, staying in the green zone of the crypto space for the past seven days and raising its price by 3.7%. Ethereum is currently caught in an inverted pennant pattern A resumption of the bearish trend is highly possible for the altcoin $1,130 might be new support marker for Ethereum The second largest cryptocurrency by market capitalization is currently trading at $1,324 according to Coingfecko at the time of this writing while its 24-hour trading volume stands at a little over $5 billion. But the widely recognized king of all altcoins and its investors should....


