TA: Bitcoin Price Could Avoid Another Drop if it Closes Above One Key Level
Bitcoin is struggling to gain pace above $21,500 against the US Dollar. BTC must clear the $22,500 resistance zone to avoid a fresh decline in the near term. Bitcoin is struggling to gain pace above the $21,500 and $21,600 levels. The price is now trading above the $21,500 level and the 100 hourly simple moving average. There is a key bearish trend line forming with resistance near $22,000 on the hourly chart of the BTC/USD pair (data feed from Kraken). The pair could start a decent increase if there is a close above the $22,000 resistance zone. Bitcoin Price Faces Hurdles Bitcoin price....
Related News
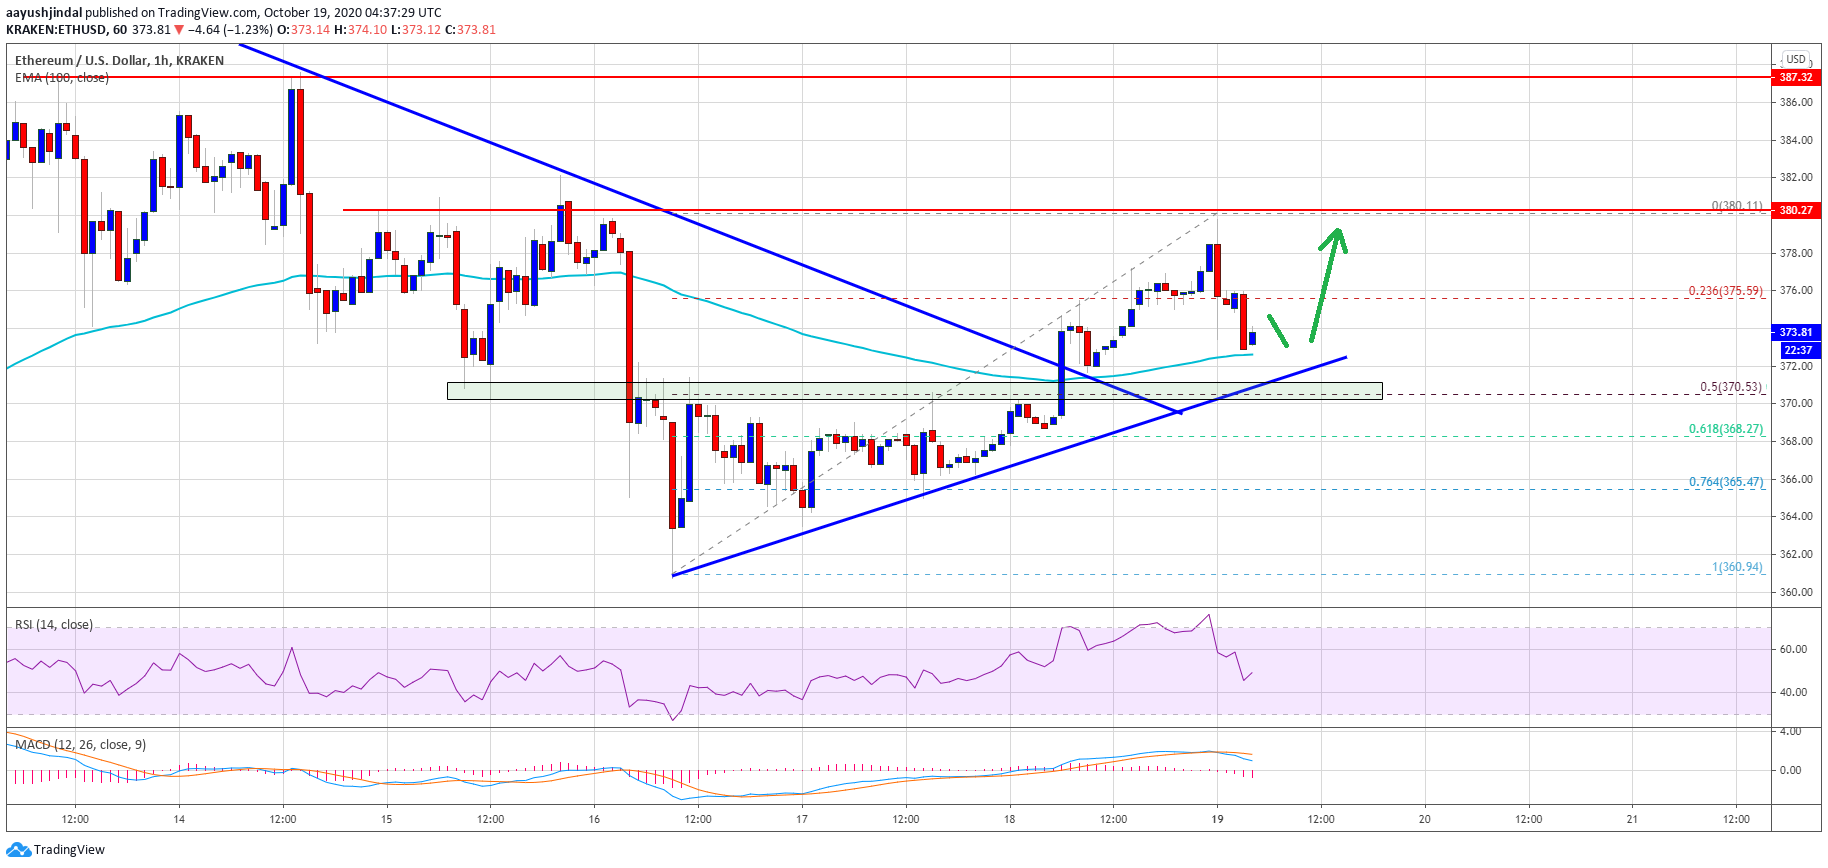
Ethereum extended its decline below the key $365 support against the US Dollar. ETH price is correcting higher and it must surpass $380 for to avoid another bearish wave. Ethereum started a decent upward move after it tagged the $360 level. The price is now trading nicely above the $370 level and the 100 hourly […]
Ethereum reacted to the downside and retested $4,050 against the US Dollar. ETH must recover above $4,250 and $4,300 to start a steady recovery wave. Ethereum started a fresh decline from the $4,350 resistance zone. The price is now trading below $4,250 and the 100 hourly simple moving average. There is a key bearish trend line forming with resistance near $4,210 on the hourly chart of ETH/USD (data feed via Kraken). The pair could extend losses if it fails to stay above the $4,050 support zone. Ethereum Price Is Facing Hurdles Ethereum attempted a recovery wave above the $4,300 resistance....
Bitcoin has now had 7 consecutive daily green candle closes this month. There have been a couple of 7 consecutive daily candle closes. But so far there has been no eight. The last time there were 8 consecutive daily candle closes, bitcoin price saw a price run-up that saw the price moving out of the $20,000 price range into the $30,000. BTC price movements after 8 consecutive daily candlesticks | Source: Twitter The chart above outlines the movement of the market the last time this happened. The run-up had started last year in 2020 and continued into 2021 before tapering off in....
The price of Solana (SOL) has been volatile against tether (USDT), causing more pain for hodlers. Despite showing such strength, the price of Solana (SOL) has risen from $30 in recent weeks to around $45, as many investors hoped for more relief rallies to around $60. Solana (SOL) prices were rejected and have continued to fall with no significant bounce. (Data from Binance) Related Reading: Solana Price Trades Laterally, What Could Be The Next Level? Solana (SOL) Price Analysis On The Weekly Chart SOL’s price dropped from $250 to around $30, representing a drop of more than 70% from....
Bitcoin had been able to break out of its red streak earlier in the year after making 11 consecutive red weekly closes. With the market recovery, the digital asset had begun to return some green weekly closes. That is until the market correction, and bitcoin lost about $4,000 off the top of its value. This resulted in a weekly close for the prior week, and even though it looked like a recovery might be on the horizon, bitcoin has recorded another red weekly close. Two Red Closes Within the last couple of weeks, bitcoin had seen some incredible movements that had returned faith in the....


