
XRP Price Battles Breakout Resistance With Momentum Showing Mixed Signals
XRP price started a fresh decline below $2.250. The price is now attempting to recover and faces resistance near the $2.32 pivot level. XRP price started a fresh decline below the $2.250 zone. The price is now trading below $2.250 and the 100-hourly Simple Moving Average. There is a bearish trend line forming with resistance at $2.2250 on the hourly chart of the XRP/USD pair (data source from Kraken). The pair could continue to move down if it settles below $2.10. XRP Price Attempts Recovery XRP price attempted a recovery wave above $2.280 but failed to continue higher, like Bitcoin and....
Related News
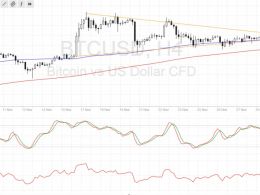
Bitcoin price followed through with its consolidation breakout and sustained its climb. Bitcoin Price Key Highlights. Following the recent upside breakout from the symmetrical triangle pattern, bitcoin price continued to climb as predicted in the earlier post. Price has now made its way to the triangle highs around $780 and is showing increased buying pressure to form new highs. Technical indicators are giving mixed signals at the moment, but it looks like the odds are in favor of more bullish action. Technical Indicators Signals. The 100 SMA is above the 200 SMA so the path of least....

XRP’s price action continues to follow a clear corrective structure, setting the stage for a potential drop toward the key $2.03 support level. With momentum cooling and Wave 2 behavior unfolding as expected, the market may be preparing for one final dip before the uprend shift emerges. Wave 2 Dynamics: Why XRP’s Choppy Pullback Is Completely Normal CasiTrades, a well-followed crypto analyst, noted in a recent market update that XRP still appears to be navigating its way toward the macro 0.5 Fibonacci retracement level at $2.03. According to the analyst, the current price action aligns....
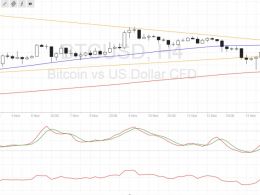
Bulls and bears are still fighting over where to take bitcoin price next, as a break from this consolidation pattern would confirm which side wins. Bitcoin Price Key Highlights. Bitcoin price has formed lower highs and higher lows, creating a symmetrical triangle on its 4-hour time frame. Price is currently testing the triangle resistance and waiting for more bullish momentum to trigger an upside break. Technical indicators are giving mixed signals at the moment but a breakout could provide longer-term direction for bitcoin trading. Technical Indicators Signals. The 100 SMA is above the....
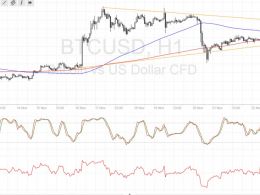
Bitcoin price is consolidating inside a symmetrical triangle formation, possibly gearing up for a strong breakout. Bitcoin Price Key Highlights. Bitcoin price has formed lower highs and higher lows, creating a symmetrical triangle pattern visible on its short-term chart. Price is currently testing support and might be due for a bounce back to the resistance. Technical indicators are giving mixed signals, although a downside break seems possible. Technical Indicators Signals. The 100 SMA just crossed below the longer-term 200 SMA to indicate that the path of least resistance is to the....
XRP is showing strong signs of a major breakout as momentum continues to build across multiple timeframes. With bullish signals aligning and key structures pointing higher, the market is beginning to price in the possibility of a much larger move, one that could push XRP toward the highly anticipated $10 level if the breakout fully unfolds. RSI Breakout Signals Strength After 1-Year Trendline Crypto analyst JD has pointed to a significant shift in momentum for XRP, noting that the Relative Strength Index (RSI) has officially broken out of a major 1-year trendline on the 3-day chart. While....