
Bitcoin Realized Losses Going Down, But Still At Significant Value
Data shows the net amount of losses being realized in the Bitcoin market is going down, but nonetheless remains at a high value. Bitcoin Net Realized Profit/Loss Still Has A Pretty Negative Value As per the latest weekly report from Glassnode, the net loss realization has reduced a bit recently, but the market is not near a neutral level of selling yet. The “net realized profit/loss” is an indicator that measures the net magnitude of profits or losses being realized by all investors in the Bitcoin market. The metric works by looking at the on-chain history of each coin being....
Related News

Capitulation and all-time high realized losses plague Bitcoing. What's really happening?

XRP on-chain pain has drawn fresh attention this week. Realized losses surged to nearly $2 billion over a one-week span. That kind of move grabs traders’ eyes because it often marks a clearing out of weaker holders. Related Reading: XRP Tipped As Central Bank Bridge Asset — Bigger Than Bitcoin? Santiment Shows Heavy Realized Losses According to Santiment, the spike is the biggest since 2022. Realized losses happen when people sell for less than what they paid. It is a measure of capitulation. In past cycles, similar spikes happened near major lows and were followed by strong rallies. 📉....
Data shows Bitcoin long-term holders have realized a significant amount of losses recently, a sign that the final capitulation before the bottom may be here. Bitcoin Long-Term Holder SOPR Shows Average of 27% Losses Being Realized This Week According to the latest weekly report from Glassnode, BTC long-term holders seem to have harvested some losses this week. The “spent output profit ratio” (or the SOPR in short) is an indicator that tells us whether Bitcoin investors are selling at a profit or a loss right now. The metric works by looking at the on-chain history of each coin....
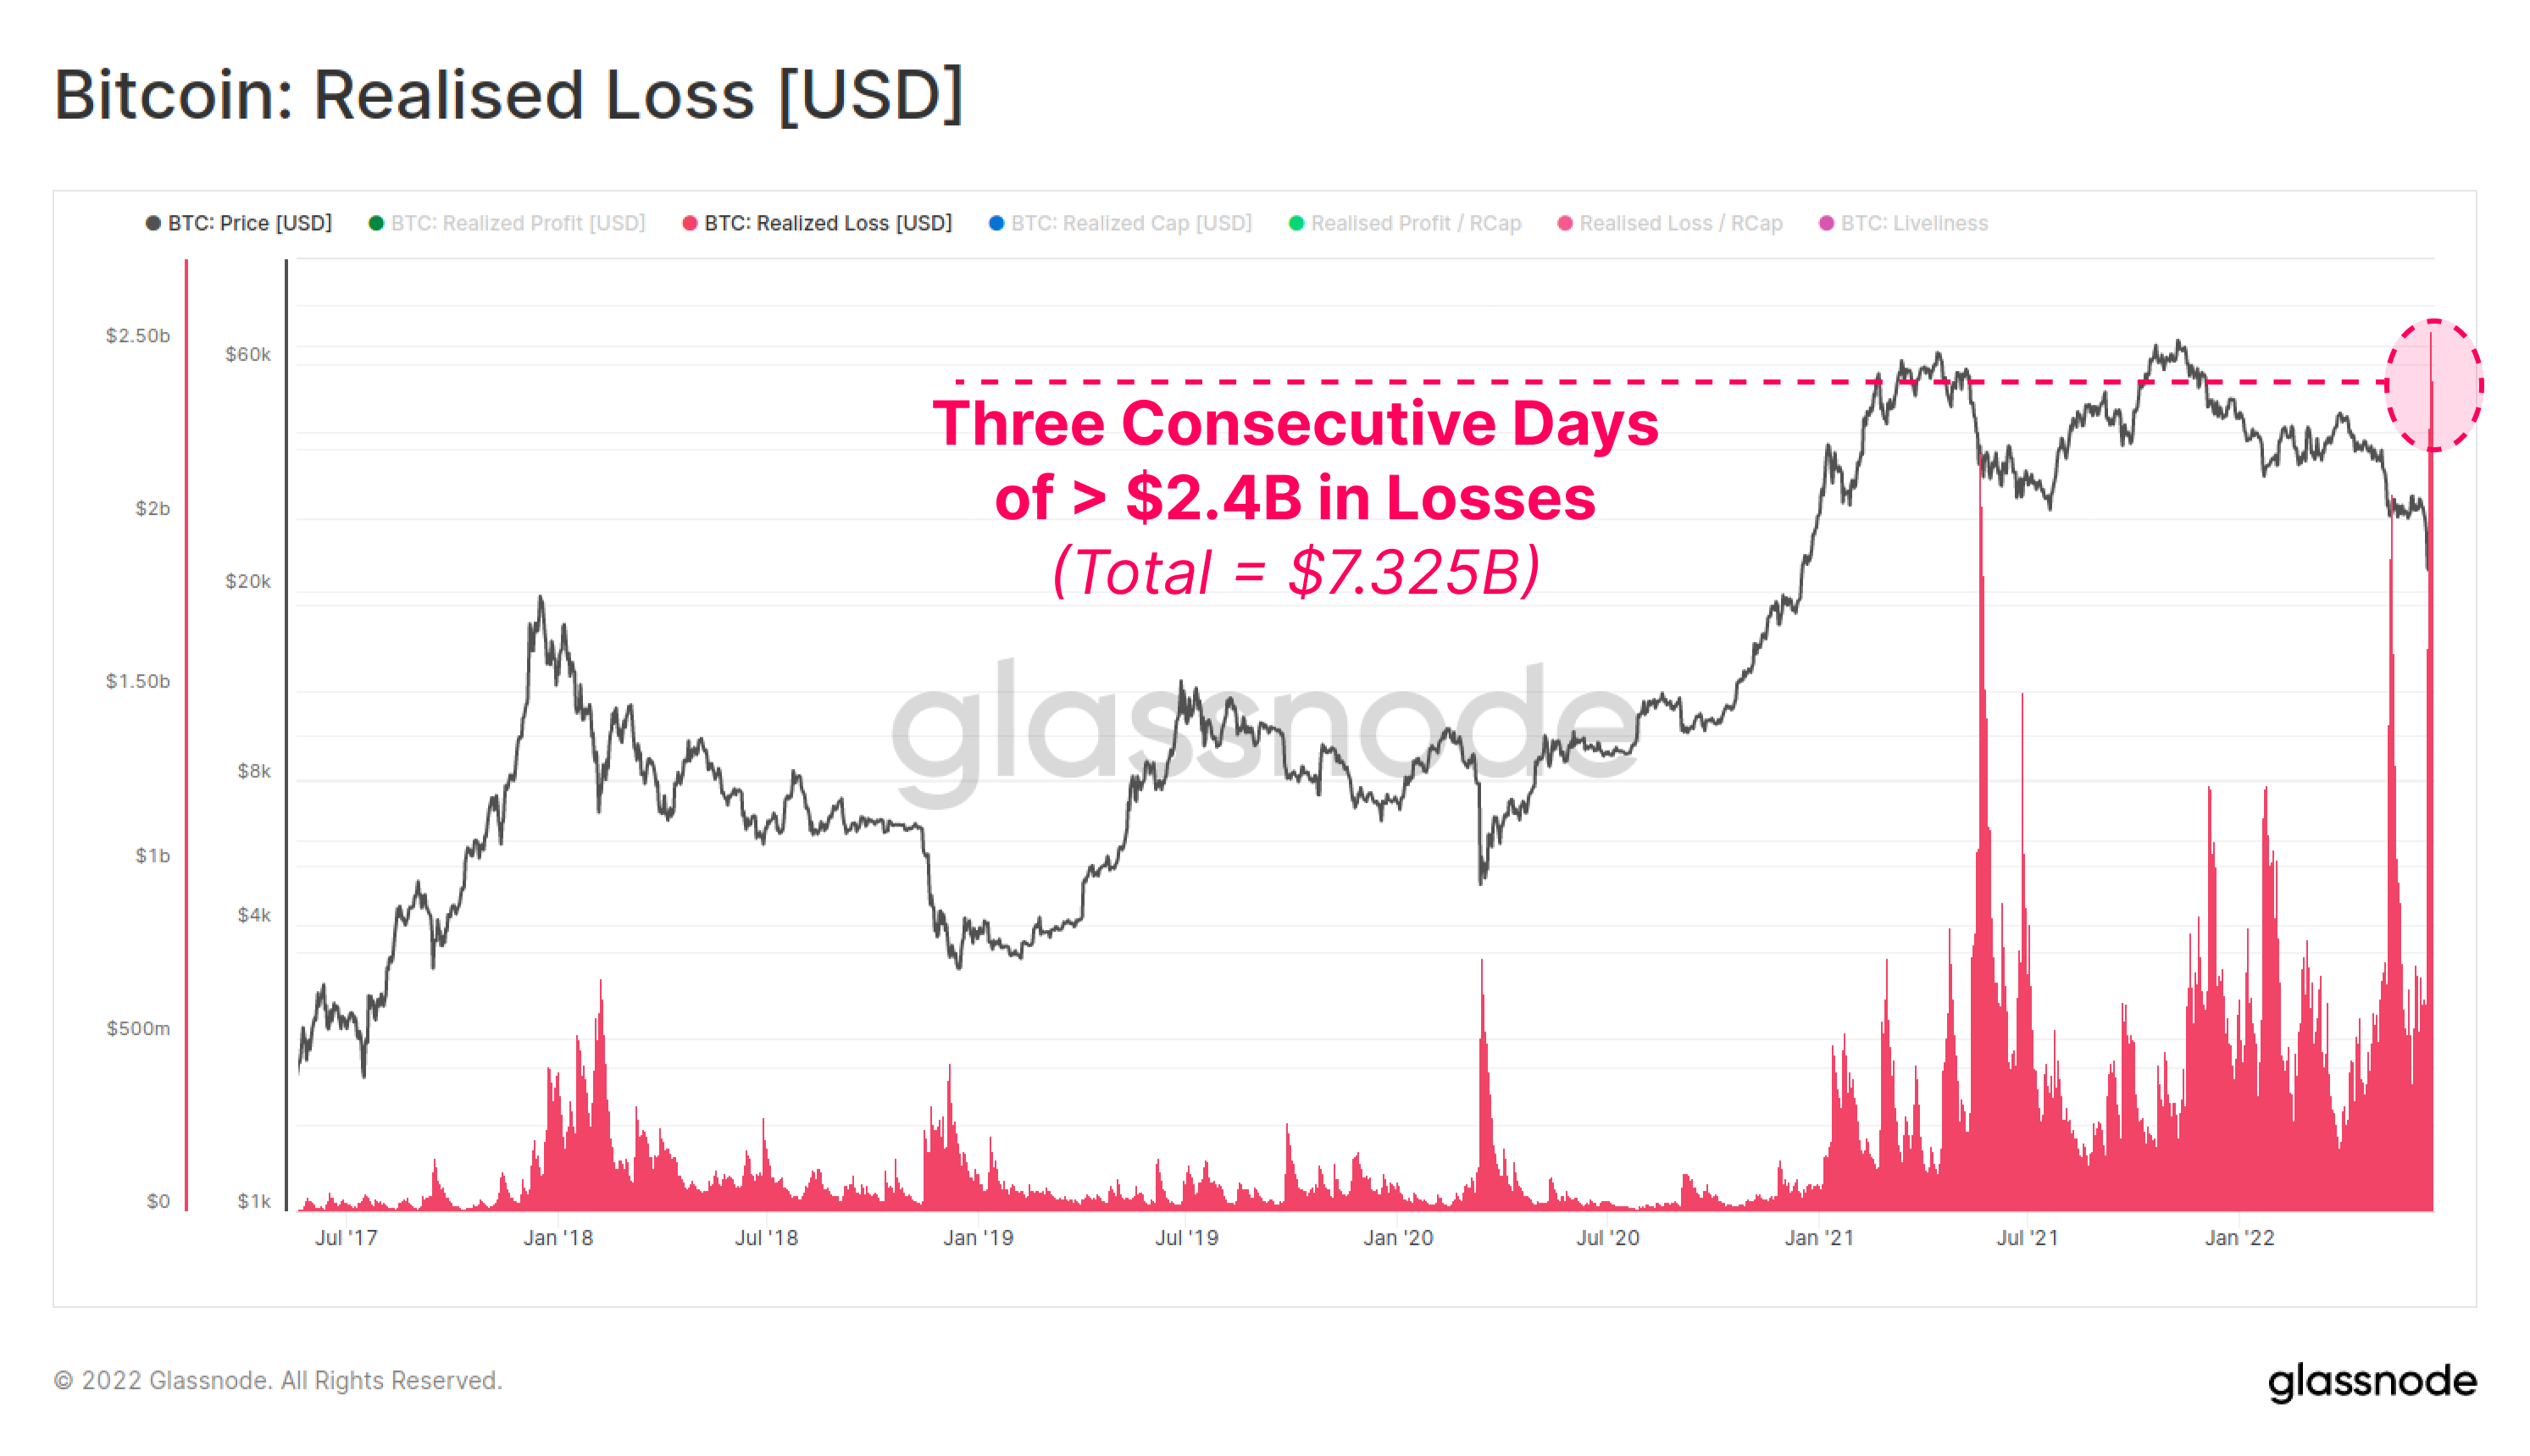
Data from Glassnode shows more than $7 billion in Bitcoin losses was realized within three consecutive days, the most in the history of the crypto. Highest Ever Bitcoin Loss Realization Took Place During The Last Few Days Latest on-chain data released by Glassnode shows BTC investors took a heavy amount of losses in the past […]

Since the market shakedown caused by the US and China tariff frenzy, Bitcoin is still battling with volatility as its price loses the $110,000 price target again after a short upward move on Sunday. With BTC’s price experiencing bearish performance, investors, especially short-term BTC holders, are seeing notable losses in their positions. Realized Losses Mount […]