Bitcoin sits at range high as realized price sparks BTC 'macro signal'
Interesting signals are being printed by several more chart indicators this week, all of which have proven to be bear market bottom markers. Bitcoin (BTC) inched closer to $22,000 on Aug. 25 as realized price provided the next major hurdle for bulls.BTC/USD 1-hour candle chart (Bitstamp). Source: TradingViewRealized price inspires confidenceData from Cointelegraph Markets Pro and TradingView showed BTC/USD grinding higher overnight to come face to face with $21,700.That level, coinciding with realized price, had marked the key flip zone to target for bullish continuation the day prior, but....
Related News
BTC bulls aim to confirm $20,000 as support as fresh on-chain data begins to signal that the bottom might be in. While Bitcoin (BTC) price support may be psychological for some traders, the statistics behind BTC remaining over $20,000 for a week are strong indicators of price support or in other words, a new bear market floor. Multiple Bitcoin data points might be able to establish a $20,000 support level. Last week Bitcoin reached a high of $20,961. However, it never sustained its upward momentum as the rally fizzled out, failing to break $21,000 support. As a result of the rally as well....
Data shows Bitcoin has broken above the realized price once again as the crypto surges to $22k. Will the recovery hold this time? Bitcoin Makes 2nd Attempt To Break Above Realized Price In 10 Days As pointed out by an analyst in a CryptoQuant post, BTC may be finally shooting above the realized price again after spending 33 days below the level in total. To understand what the “realized price” is, it’s best to first take a look at a quick explanation of the two main capitalization methods for Bitcoin. The “market cap” is calculated by multiplying each coin in....
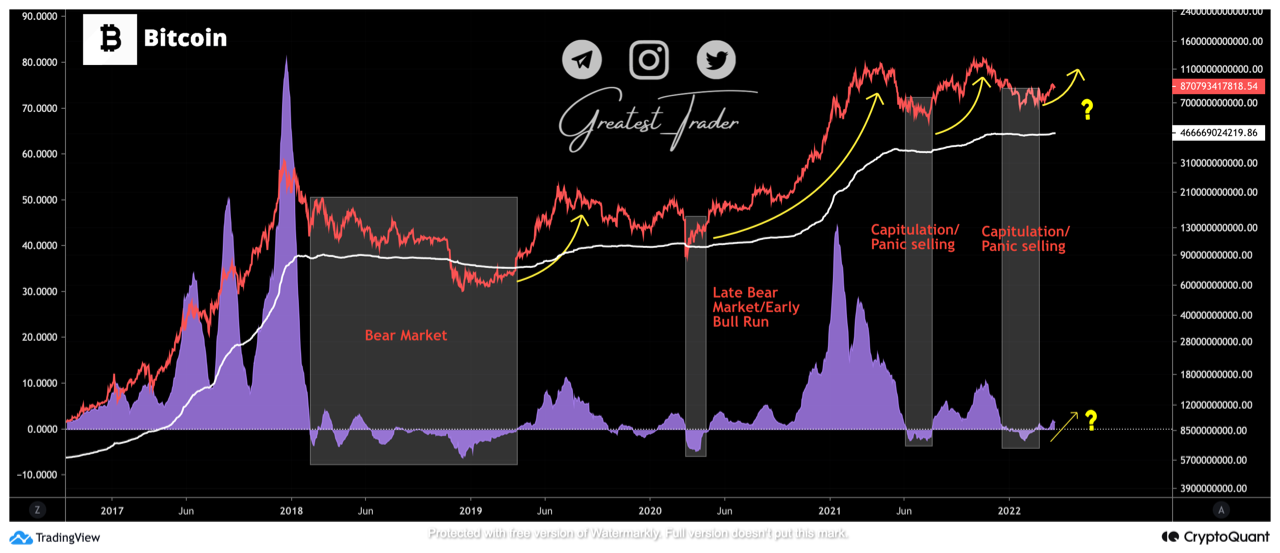
The current trend of the Bitcoin realized cap has formed a pattern that has historically been a bullish signal for the crypto’s price. Bitcoin Realized Cap 30-Day Rate Of Change Has Turned Positive As pointed out by an analyst in a CryptoQuant post, the BTC realized cap 30-day rate of change has just turned positive […]
Bitcoin price finally pushed through a tough resistance cluster to secure a new all-time high at $60,000. Bitcoin (BTC) hit $60,000 for the first time on March 13 as the long-awaited continuation of the BTC price bull run got underway.BTC/USD 1-hour candle chart (Bitstamp). Source: TradingviewBTC records another landmark price levelData from Cointelegraph Markets and Tradingview tracked BTC/USD as the pair finally crossed the historic level after several weeks of mild corrections and periods of consolidation.Bulls had spent a considerable time in limbo as Bitcoin tested prior all-time....
BTC on-chain metrics and technical indicators are trading near historical bottoms, but analysts say a new “macro catalyst” could prove the current range is not the bottom. From a historical perspective, the loss in value realized across the cryptocurrency market over the past several months has been one for the record books and the total cryptocurrency market cap has declined from $3 trillion to $991 million. June was especially painful for investors after the price of Bitcoin (BTC) fell nearly 40% to mark one of its worst calendar months on record according to a recent report from....


