
Bitcoin price bottom takes shape as 'old coins' hit a record 78% of supply
Bitcoin's long-term holders' NUPL metric has dropped to levels that coincided with market bottoms thrice since November 2011. Bitcoin (BTC) and the rest of the crypto market have been in a bear market for almost a year. The top cryptocurrency has seen its market valuation plummet by more than $900 billion in the said period, with macro fundamentals suggesting more pain ahead.Another bear cycle produces more BTC hodlersBut the duration of Bitcoin's bear market has coincided with a substantial rise in the percentage of BTC's total supply held by investors for at least six months to one year.....
Related News

Past trend of the Bitcoin actual/realized price ratio may be forming a pattern that could hint at a possible bottom for the crypto at $17k. Bitcoin Actual/Realized Price Ratio Currently Has A Value Of 0.8 As pointed out by an analyst in a CryptoQuant post, historical data of this BTC ratio may have interesting implications for the current market. The realized cap is a capitalization model for Bitcoin that multiplies each coin in the circulating supply with the price at which the coin was last moved and takes the sum of all the values. This is different from the usual market cap, where the....
The bitcoin bear market has continued on recently as the crypto has failed to keep up any upwards momentum. How low can the price go before a bottom is in? Bitcoin Price Models Put Different Targets For The Cycle Bottom A recent post by CryptoQuant has discussed about the various pricing models for BTC and where they may suggest a potential bottom to be. Before looking at the data of these price models, it’s best to first get a grasp of the major Bitcoin capitalization models. The normal market cap of the crypto is calculated by taking the sum of the entire circulating supply and....
On-chain data shows Bitcoin is currently not satisfying a condition that has historically occurred alongside major bottoms in the price. Bitcoin Supply In Profit Is Still Greater Than Supply In Loss In a new post on X, James V. Straten, a research and data analyst, has pointed out how BTC isn’t fulfilling the bottom condition for the supply in profit and loss metrics. The “supply in profit” here naturally refers to the total amount of Bitcoin supply currently carrying an unrealized profit. Similarly, the “supply in loss” keeps track of the number of underwater....
Bitcoin is back above $70,000 after a bruising first quarter, but there are still questions as to whether the asset has already established its cycle low or is still moving through a bottoming phase. A technical indicator following one interesting Bitcoin metric is presently showing signs that the bottom may not yet be in. The Metric With A Perfect Record One Bitcoin metric has always predicted every cycle bottom, and what it is saying now is very important for its next outlook. This metric is the long-term holder supply in loss, which is a measure that tracks how much of the supply held....
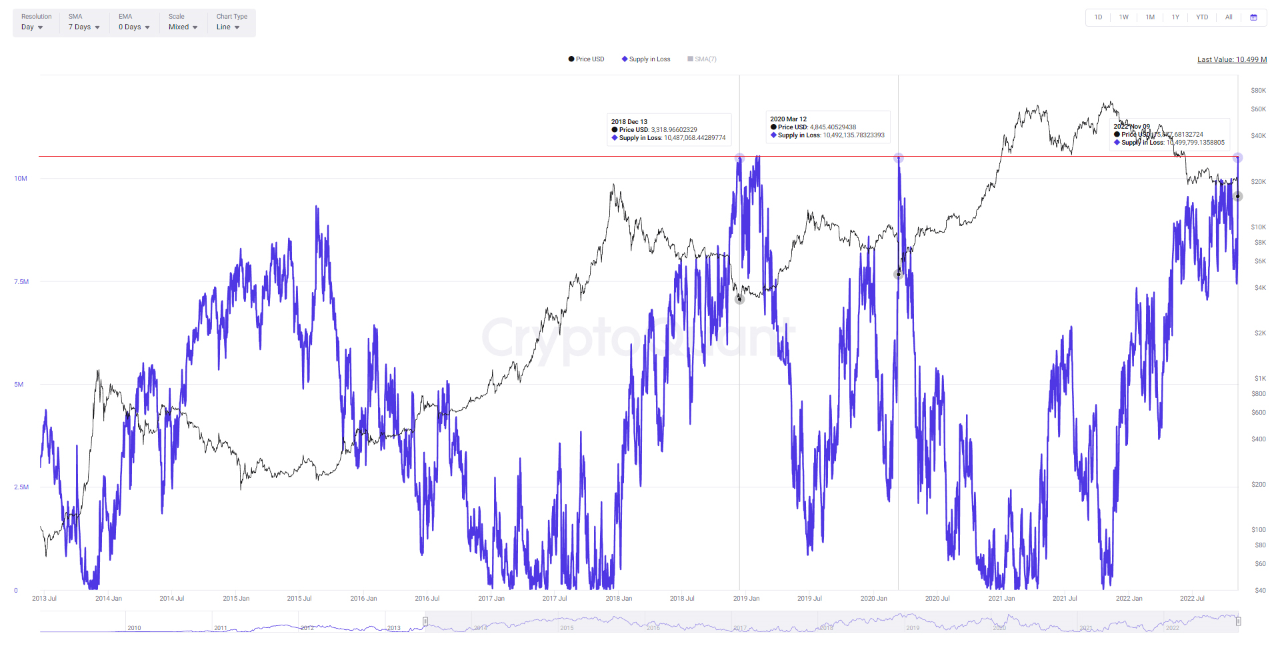
On-chain data shows the amount of Bitcoin supply in loss has now reached levels similar to during the COVID crash and the 2018 bear market bottom. Bitcoin Supply In Loss Spikes Up Following The Latest Crash As pointed out by an analyst in a CryptoQuant post, the BTC supply in loss has set a new record for this year following the FTX disaster. The “supply in loss” is an indicator that measures the total amount of Bitcoin that’s currently being held at some loss. This metric works by looking at the on-chain history of each coin in the circulating supply to see what price it....