
Bitcoin Price Sees Short-Term Dip — Bulls Plot Their Next Move
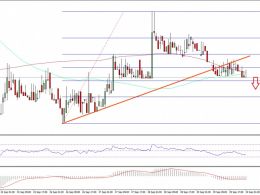
Bitcoin price is correcting gains from the $95,000 zone. BTC is back below $94,000 and might test the $91,200 support zone in the near term. Bitcoin started a minor downside correction below the $94,000 zone. The price is trading below $94,000 and the 100 hourly Simple moving average. There is a connecting bearish trend line forming with resistance at $94,000 on the hourly chart of the BTC/USD pair (data feed from Kraken). The pair could start another increase if it clears the $94,200 zone. Bitcoin Price Starts Downside Correction Bitcoin price remained stable above the $90,000 level and....
Related News
Ethereum price was trading above a short-term support versus the US Dollar until sellers appeared and took ETH/USD lower. Key Highlights. ETH price after failing to retain the bullish bias against the US Dollar failed and moved down. Yesterday’s highlighted bullish trend line on the hourly chart (data feed via SimpleFX) of ETH/USD was cleared by sellers during the recent downside. ETH bulls must trade carefully, as there is a chance of a downside move in the short term. Ethereum Price Downside Move. Ethereum price looks like made a short-term top near $13.21 against the US Dollar. There....
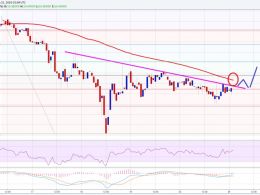
Ethereum price looks like looking for a short-term upside ride. There is a chance of a break higher and a move towards $11.00-50. Intraday Support Level can be $9.50. Intraday Resistance Level may be $10-80. Ethereum price traded twice this past week after a minor correction. There was a lot of bearish pressure noted on the ETH bulls that ignited a downside move. My idea of selling worked twice this past week and we were on the right side. Now, the price is currently making an attempt to correct higher, and it looks like it may break higher in the short term. There is a bearish trend line....

Key Highlights. Dogecoin price looks like created a short-term top and may continue to move lower moving ahead. The highlighted resistance area at 41.0 Satoshis proved a crucial barrier and might push the price down. If sellers manage to break 38.0 Satoshis, then a move towards 36.0 Satoshis is possible in the near term. Dogecoin price failing to move above 41.0 Satoshis is a bearish sign and could ignite another round of selling if sellers step in. Downside Slide in Dogecoin Price. Dogecoin price had no relief, as there were no signs of bulls. On the other hand, there are a few signs on....
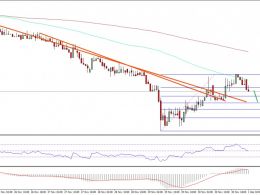
Ethereum price managed to move higher against the USD and BTC. Can this move in ETH/USD be considered as a positive sign in the short term? Key Highlights. ETH price after a long struggle finally managed to trade a few points higher against the US Dollar and Bitcoin. This week’s highlighted bearish trend lines on the hourly chart (data feed via SimpleFX) of ETH/USD were broken to clear the upside move. The price traded near $8.50 where it found sellers and currently correcting lower. Ethereum Price Short-term Break. ETH price after a continuous decline against the US Dollar managed to gain....

All hell has broken loose in the Bitcoin market! The price of Bitcoin crashed more than 13 percent intraday after bears crushed the bulls following the Bitcoin XT controversy. As of now, short covering has helped lift the price up to $235.66, still off more than 7 percent. With this, all the hard work done by the bulls since June has been undone. In the previous Bitcoin price technical analysis, The Pressure is Simply Too Much, I had clearly stated that if the selling pressure were to increase even slightly, it would lead to a breakdown kind of situation in the cryptocurrency. My short....