Ethereum Price Technical Analysis 03/21/2016 – Short-Term Spike Possible?
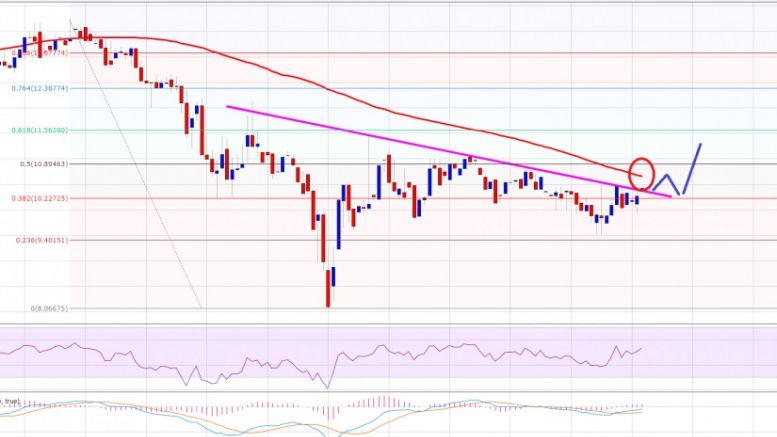
Ethereum price looks like looking for a short-term upside ride. There is a chance of a break higher and a move towards $11.00-50. Intraday Support Level can be $9.50. Intraday Resistance Level may be $10-80. Ethereum price traded twice this past week after a minor correction. There was a lot of bearish pressure noted on the ETH bulls that ignited a downside move. My idea of selling worked twice this past week and we were on the right side. Now, the price is currently making an attempt to correct higher, and it looks like it may break higher in the short term. There is a bearish trend line....
Related News
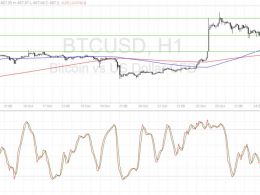
Bitcoin price had a volatile run but remains stuck inside its short-term range. Bitcoin Price Key Highlights. Bitcoin price volatility picked up recently but it was unable to bust out of its range. Both bulls and bears attempted for a breakout but the cryptocurrency is still trapped between support at $658 and resistance at $670. Technical indicators are suggesting that the longer-term climb could carry on and that another upside breakout attempt could take place. Technical Indicators Signals. The 100 SMA is still above the longer-term 200 SMA, which means that the path of least resistance....
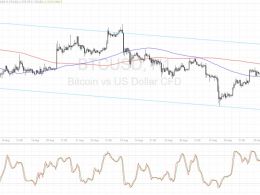
Bitcoin price could be ready to resume its selloff upon testing the descending channel resistance visible on its short-term charts. Bitcoin Price Key Highlights. Bitcoin price is still trending lower on its short-term time frames, moving inside a descending channel on its 1-hour chart. Price is on a climb but might be due for a selloff soon since it is already near the ceiling at the channel resistance. A short-term double-top can be seen, also suggesting a reversal from the recent rally. Technical Indicators Signals. The 100 SMA is below the 200 SMA on this time frame, which means that....
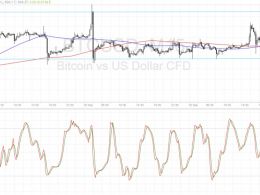
Bitcoin price could be due for another test of the short-term range support, with technical indicators supporting a bounce. Bitcoin Price Key Highlights. Bitcoin price has been treading carefully inside a tight range visible on its short-term charts. Price seems to have lost bullish momentum and is headed for the bottom of the range at $601.50. Technical indicators are hinting that losses could be kept in check. Technical Indicators Signals. The 100 SMA is above the longer-term 200 SMA on this time frame, hinting that the path of least resistance is still to the upside. In fact, bitcoin....
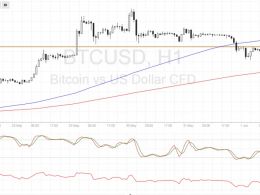
Bitcoin price appears to be correcting from its recent selloff but technical indicators are signaling that a longer-term bounce might be in order. Bitcoin Price Key Highlights. Bitcoin price is pulling up from its recent slide but could be in for more gains if sellers hop in the short-term area of interest. Support at $555 was previously broken and might hold as resistance moving forward. Technical indicators, however, are suggesting that the climb could continue. Technical Indicators Signals. The 100 SMA is safely above the 200 SMA so the path of least resistance is still to the upside.....
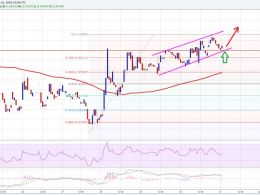
Ethereum price popped above a major resistance area of $11.80. Now, can it provide support and push ETH higher versus the USD? Ethereum price kept struggling near the $11.80 resistance area, as highlighted in yesterday’s post. However, the ETH bulls finally managed to take the price above the stated level, and there was an hourly close above it. Now, the price is moving down, and the same resistance area is currently acting as a support and helping the bulls to regain ground. There is an ascending channel pattern formed on the hourly chart (data feed via Kraken) of ETH/USD, which may play....