Bitcoin Price Technical Analysis for 23/3/2015 - Support Established
The digital currency Bitcoin has jumped sharply from the lows of $250 registered on March 18 to $268.52 today. In my previous Bitcoin analysis Troubled Waters, I mentioned a possibility of the cryptocurrency surging towards $280 if it broke above $265. The resistance level has been taken out and retested thrice to stamp it as a support level, at least for the short term. Although I still believe that Bitcoin will hit $230 in the medium term, a rise may be witnessed in the near term, which could be used as an opportunity to exit the long positions or create fresh shorts. An analysis of the....
Related News
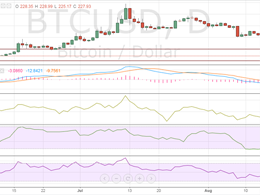
In the previous Bitcoin price technical analysis Rebounds, we discussed how the cryptocurrency was erasing the losses for the past week. But, the entire positivity was put to rest over the weekend as bears made a comeback and long positions were fast liquidated at the slightest hint of a pullback. Bitcoin, which is now trading at $227.93, has once again come closer to its important buying interest zone of $220-225. As the price decline has pushed the price closer to its crucial support, market participants may also be factoring in a breach of support this time, but I would recommend....
The Bitcoin price is little changed from yesterday and is still hovering near the crucial level of $265. But, the chart structure has witnessed a dent and the hopes of reaching $280 are now hinged on the upward sloping Short-term Support (marked in the chart below). An analysis of the BTC/USD 240-minute price chart has been presented here. Chart Structure - In my yesterday's BTC/USD analysis titled Support Established, I mentioned that Bitcoin had broken out from the contracting channel and was sustaining above $265. But, in the past 12 hours, the digital currency has cracked below this....
Bulls have faltered in their upward march and given to the bears an opportunity to gain control. As a result, technically important support levels have been breached which could lead to more losses in the value of Litecoin. In my previous analysis, From Resistance to Support!, I did mention that all the long positions must be built with strict stop-losses. Since the supports have been breached, a lot of long positions may have been squared. Litecoin is down 1.66% to $1.771 since yesterday. Technical analysis of the 240-minute LTC/USD price chart reveals that market participants should look....
I will resume writing a daily LTC price technical analysis starting from today, so throughout this article, I will try establishing some key resistance and support points that would help us read through the charts and detect clues that can predict future price movements. Last week, LTC price surged to exceed $4 on the 31st of October. The bullish wave started a day earlier than Bitcoin's surge and Litecoin's price rose from $3 to around $3.72 last Sunday. However, as Bitcoin's price rose above the $340 resistance level, LTC also continues to print higher highs. Bulls in Control On 1 Day....
Litecoin is trading 0.31% or $0.014 down at $4.536 as selling pressure increases. While the price sustains above the support provided by $4.100, it may seem that a base may have been hit, but before establishing that we must take into consideration what the technical indicators are conveying. And I think they are pointing towards what was discussed in my previous analysis titled This May Turn Real Ugly! Litecoin Chart Structure - Litecoin has been repeatedly testing the support line but has failed at achieving a higher high on the rebound. The cryptocurrency is witnessing what is aptly....


