Bitcoin Price Technical Analysis for 9/4/2015 - Bearish Continuation
This week, bitcoin found resistance around 262 and formed a head and shoulders with a neckline around 256. After the breakout, there was a period of consolidation, where we saw bulls fail to reach back to the shoulder level around 260. Instead, after a session of consolidation, price fell sharply during the April 8th session. As we enter the April 9th session, btcusd looks poised to continue a bearish trend. Bitcoin (BTCUSD) 1H Chart April 9. The 1H chart shows that price fell sharply after confirming the head and shoulders top, it is now under the cluster of 200-, 100-, and 50-hour SMAs.....
Related News
Not much happened today in the price action of litecoin. As we can see in the 1H chart, price has been drifting sideways since the cryptocurrency rallied from around 1.60 to about 1.82. While price is indeed still in this consolidation range, we can see a bearish bias. Litecoin (LTCUSD) 1H Chart April 1, 2015. 1) The 200-, 100-, and 50-hour simple moving averages (SMAs) are in bearish alignment and are sloping down. 2) Price is starting to hold below the cluster of these SMAs, which shows bearish bias. 3) The RSI has held below 60, and has tagged 30, showing development of bearish....
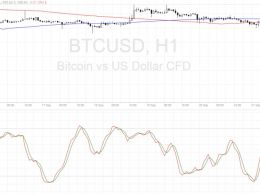
Bitcoin price looks ready continue is dive on a break of this bearish continuation pattern, with technicals signaling further declines. Bitcoin Price Key Highlights. Bitcoin price recently made a sharp break below a short-term consolidation pattern, which means that sellers have taken control. Price seems to have formed a bearish continuation signal as more sellers could take it down. Technical indicators are also confirming that selling pressure is mounting. Technical Indicators Signals. The 100 SMA is moving below the longer-term 200 SMA, confirming that the path of least resistance is....
Last week, bitcoin found support just above 216 and rebounded to about 230. After that, it ended the week with a bearish continuation attempt, which held back as it found support at a common support around 220. Bitcoin (BTCUSD) 1H Chart April 20. Here are some observations in the 1H chart: 1) Bitcoin Price is under the 200-, 100-, and 50-hour SMA, which means it still maintains a bearish bias as we get ready for another week. 2) The RSI has been oscillating between 30 and 70, which means there is no directional momentum yet. The fact that it is falling below 40 shows that the previous....
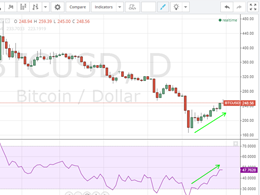
Bitcoin price continued rising, emphasizing the bullish wave that started earlier this week. Yesterday, the price pushed upwards until it touched the $256 resistance line. The price reached a high of around $259 yesterday, before falling to $249 at the time of writing of this article. Basic and technical analyses are in favor of continuation of the bullish trend to push the price even higher. By studying the 1 day Bitfinex (BTC/USD) charts from tradingview.com, we can notice a reversal of the bearish trend on the 14th of January. By plotting the Relative Strength Index (RSI) on the same....
Bitcoin has been consolidating over the weekend following a bearish swing last week from about 262 down to 230. Then, price started to consolidate between the 230 low and a high around 240. The 1H chart shows the small range where price is now hugging the 50-hour SMA. With the 100-, and 200-hour SMAs still above, sloping down, and in bearish alignment, bitcoin maintains a bearish bias within the consolidation. Bitcoin (BTCUSD) 1H Chart April 13. Bearish Scenario is Favored: Furthermore, the RSI remained under 60, which reflects maintenance of the bearish momentum. The favored scenario is....


