Bitcoin Price Technical Analysis for 25/6/2015 - Threatening the Support!
Bitcoin has slid another 1.31% to $239.85 and is threatening to break the crucial support zone of $238-240. The decline comes in the aftermath of the fallout between the Greek government and its creditors; the creditors have rejected Greek Prime Minister's bailout proposals and in return, the Greek government turned down the creditors' counter-proposal. In all of this, Bitcoin has remained fairly strong and is still closing above $240. Bitcoin is a risky trade right now: the technical indicators are saying 'sell' while the support zone is still being respected. Check out the technical....
Related News
Bitcoin has jumped more than 4% to $456.75 as bulls take advantage of the positive technical undertone. With this, the cyptocurrency has also met our prescribed target of $458. So, should you be booking profits now? Let us find that out with the help of technical analysis conducted on a 4-h BTC-USD price chart taken from BITSTAMP. Chart Structure – Bitcoin is now threatening to take out the Triple Top resistance near $465. The resurgent bulls look in complete control of the situation. Bollinger Bands – The cryptocurrency is sustaining above the upper range of the BB, after taking support....
Bitcoin can be seen consolidating around $242 after threatening the support of $240. It is now trading up 0.79% at $241.75. While it may look like Bitcoin has successfully managed to hold its ground, its fate is still hanging by a thread. Why do I say this? Read the technical analysis of the 240-minute BTC-USD price chart below. Bitcoin Chart Structure - Even when Bitcoin was being pressured below $240, it did not close below this crucial level and after spending considerable time standing on this support, Bitcoin decided to edge higher. But just when it looked that bulls would make a good....
In the 1H Litecoin chart, we can see a market that has been consolidating since last week when price action shook and created a range between roughly 1.61 and 1.81. Litecoin (LTCUSD) 1H Chart 2/4/2015. During this consolidation, price action has displayed bearish bias for the most part as ltcusd held under the 200-hour SMA, and for the most part under the 100-, and 50-hour SMAs as well. Meanwhile, the RSI has been holding below 60 after tagging 30. Now as we get into the April 2nd session, price has rallied above the 100-, and 50-hour SMAs and is now threatening the 200-hour SMA. Also,....
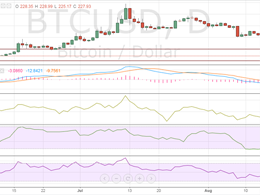
In the previous Bitcoin price technical analysis Rebounds, we discussed how the cryptocurrency was erasing the losses for the past week. But, the entire positivity was put to rest over the weekend as bears made a comeback and long positions were fast liquidated at the slightest hint of a pullback. Bitcoin, which is now trading at $227.93, has once again come closer to its important buying interest zone of $220-225. As the price decline has pushed the price closer to its crucial support, market participants may also be factoring in a breach of support this time, but I would recommend....
Bulls have faltered in their upward march and given to the bears an opportunity to gain control. As a result, technically important support levels have been breached which could lead to more losses in the value of Litecoin. In my previous analysis, From Resistance to Support!, I did mention that all the long positions must be built with strict stop-losses. Since the supports have been breached, a lot of long positions may have been squared. Litecoin is down 1.66% to $1.771 since yesterday. Technical analysis of the 240-minute LTC/USD price chart reveals that market participants should look....


