Bitcoin Price Technical Analysis for 18/8/2015 - The Pressure is Simply Too Much
I had said in the previous Bitcoin price technical analysis Can Bitcoin Survive This? with high optimism that the current price level may attract inflow to stem the decline. However, I have been proved wrong. The selling pressure is overwhelming the bulls, and a further increase may lead to a breakdown kind of situation in Bitcoin. Bitcoin is currently available at $255.47, down 0.49 percent. I had also pointed out earlier that if the bulls are thrashed in the next couple of sessions, there will be a higher probability of the price skidding to the consolidation zone near $240. I still....
Related News
All hell has broken loose in the Bitcoin market! The price of Bitcoin crashed more than 13 percent intraday after bears crushed the bulls following the Bitcoin XT controversy. As of now, short covering has helped lift the price up to $235.66, still off more than 7 percent. With this, all the hard work done by the bulls since June has been undone. In the previous Bitcoin price technical analysis, The Pressure is Simply Too Much, I had clearly stated that if the selling pressure were to increase even slightly, it would lead to a breakdown kind of situation in the cryptocurrency. My short....
Bitcoin is seeing a tepid start to this week as neither the bulls nor the bears exert any pressure on the other. The cryptocurrency looks relatively calm in the low-volume season, as do the technical indicators. Market participants should refrain from excessive trading in such conditions. Bitcoin is currently trading at $421.53. The technical indicators overlaid on the 4-h BTC-USD price chart from BITSTAMP are giving mixed signals. This, coupled with the lackluster price action, is compelling me to advise that this is a no-trade market, and one should wait for better opportunities to....
Litecoin has dropped 6.47 percent to trade at $2.733 as the underlying negativity comes to the fore. We discussed in the previous Litecoin price technical analysis The Pressure is Evident that there is a very low probability of the price trending higher and that bears may make an early comeback. This decline has also brought the price closer to its very important technical support of the 200-day simple moving average (SMA). The question that the trading community is now asking is: will this level cushion Litecoin once again? I continue to remain bearish on Bitcoin as well, which I believe....
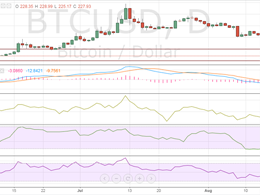
In the previous Bitcoin price technical analysis Rebounds, we discussed how the cryptocurrency was erasing the losses for the past week. But, the entire positivity was put to rest over the weekend as bears made a comeback and long positions were fast liquidated at the slightest hint of a pullback. Bitcoin, which is now trading at $227.93, has once again come closer to its important buying interest zone of $220-225. As the price decline has pushed the price closer to its crucial support, market participants may also be factoring in a breach of support this time, but I would recommend....
Bitcoin has crossed the crucial resistance mentioned in A Breakout Everybody's Waiting For!, rising roughly 1.54% to trade at $235.75. The price appreciation has also led to overbought valuation for Bitcoin which might face stiff resistance from the next supply region at around $238. So, should you be buying Bitcoin now or not? Let's find out in the technical analysis below! Technical analysis of the above presented 240-minute BTC/USD price chart indicates that bulls have complete control over the situation and that Bitcoin is a pure buy-on-dips play. Bitcoin Chart Structure - After....


