Bitcoin Price Technical Analysis for 1/9/2015 - Waiting for that big move
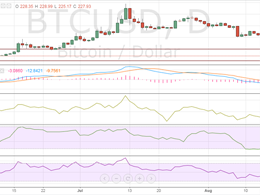
The ongoing spree of extremely thin trading sessions has taken many market participants by surprise. After hitting levels of sub-$200, Bitcoin raced back up to hit $235-237 but very few would have expected the cryptocurrency to have gone tight-ranged since then. Bitcoin is currently trading at $229.14, up 0.94 percent as the bulls manage to keep the price hovering near the resistance. As Bitcoin continues to trade near the recent highs, expectations are rising that the cryptocurrency may eventually pierce the resistance, but let us find out what the latest technical indications are.....
Related News
In the previous Bitcoin price technical analysis Rebounds, we discussed how the cryptocurrency was erasing the losses for the past week. But, the entire positivity was put to rest over the weekend as bears made a comeback and long positions were fast liquidated at the slightest hint of a pullback. Bitcoin, which is now trading at $227.93, has once again come closer to its important buying interest zone of $220-225. As the price decline has pushed the price closer to its crucial support, market participants may also be factoring in a breach of support this time, but I would recommend....
Bitcoin briefly topped $250 for the first time since August 19, 2015, hitting a fresh monthly high of $250.09. We concluded the previous Bitcoin price technical analysis Retreats From Monthly Highs on a positive note saying that market participants should not be concerned about the drop and instead go long in Bitcoin near $242 for a target of $250. As can be seen, Bitcoin hit an intraday low of $242.82 before meeting the said target. Bitcoin is currently trading at $248.81, up 1.92 percent. And yes, we stand by our long call! bitcoin price chart. Below are the latest technical....
Bitcoin has crossed the crucial resistance mentioned in A Breakout Everybody's Waiting For!, rising roughly 1.54% to trade at $235.75. The price appreciation has also led to overbought valuation for Bitcoin which might face stiff resistance from the next supply region at around $238. So, should you be buying Bitcoin now or not? Let's find out in the technical analysis below! Technical analysis of the above presented 240-minute BTC/USD price chart indicates that bulls have complete control over the situation and that Bitcoin is a pure buy-on-dips play. Bitcoin Chart Structure - After....
An absolute calm has engulfed Dogecoin as the price remains trapped in a tight range of 50.8-51.9 satoshis. The market is severely testing the patience of the short-term traders, who now fear that a surprise breakout could trigger huge losses. The market may be waiting for a trigger to break free but until that happens, it would only be wise to trade the range with minimum quantities. Dogecoin price chart, Dogecoin analysis. Nothing much has changed in the past 24 hours in terms of price (the current value of each Dogecoin is 51.1 satoshis) but the chart structure has definitely....
Litecoin bears have been smoked by the massive 27% rally in the past 24 hours following a high volume breakout from the range I discussed in my previous analysis, New Range. The surreal rise in Litecoin price has also pushed it to the highest level of 2015. Litecoin is currently trading at $3.871, a strong advance from yesterday's $3.047. Litecoin's jump to a fresh 2015-high closely follows Bitcoin's leap to a new June high, as the Greece crisis comes to its D-day. A technical look at the 240-minute LTC-USD price chart above tells that Litecoin has entered the "no-buy" zone due to its....


