
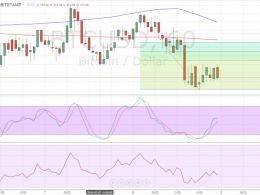
Bitcoin Price Technical Analysis for 13/01/2016 - Sellers Unite!
Bitcoin price could undergo stronger bearish momentum in the coming days after it broke below the ascending triangle support. With this downside break, bitcoin price could eventually make its way towards the $400 area of interest. The triangle chart pattern spans $350 to $465 so the resulting breakdown could last by the same amount, although there are near-term support areas visible. The short-term 100 SMA is currently holding as a dynamic support level but it is below the longer-term 200 SMA so the path of least resistance is to the downside.
Related News
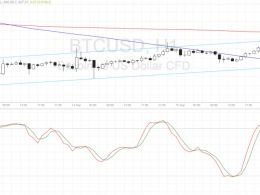
Bitcoin price showed bearish momentum but sellers might need to make a correction before taking it lower. Technical indicators are giving mixed signals for now. Using the Fib tool on the latest breakout move shows that the 38.2% correction level lines up with a broken short-term support around $373. the 61.8% Fib is close to the 200 SMA, which typically acts as a dynamic resistance level. However, the 100 SMA is still above the 200 SMA so the path of least resistance might be to the upside and bitcoin price could go for another round of gains. A downward crossover appears to be brewing....
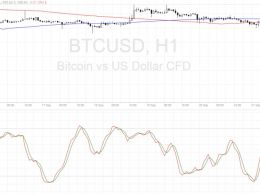
Bitcoin price is sustaining its climb but there are technical signals hinting at a possible selloff. Bitcoin Price Key Highlights. Bitcoin price is still trending higher, moving inside an ascending channel pattern on its 1-hour chart. Price is cruising around the mid-channel area of interest, as buyers and sellers are likely waiting for more directional market clues. Technical indicators seem to be suggesting that a reversal is imminent, though. Technical Indicators Signals. The 100 SMA is below the longer-term 200 SMA so the path of least resistance is to the downside. Also, the gap....
Bitcoin price appears to be correcting from its recent selloff but technical indicators are signaling that a longer-term bounce might be in order. Bitcoin Price Key Highlights. Bitcoin price is pulling up from its recent slide but could be in for more gains if sellers hop in the short-term area of interest. Support at $555 was previously broken and might hold as resistance moving forward. Technical indicators, however, are suggesting that the climb could continue. Technical Indicators Signals. The 100 SMA is safely above the 200 SMA so the path of least resistance is still to the upside.....

Ethereum Price Key Highlights. After spending weeks inside a rising wedge pattern, ethereum price finally picked a direction and might be ready for a sustained move. Price could head further south now that it broke below the rising wedge support. However, the previous breakdown failed to draw enough momentum. Ethereum price could have another chance at going for a longer-term trend, as it made a strong downside break from a consolidation pattern. How Low Can It Go? Ethereum price is currently testing the support at the moving averages, which have previously held as dynamic inflection....
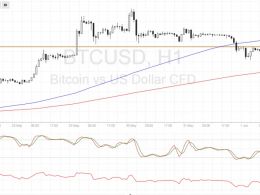
Bitcoin price looks ready continue is dive on a break of this bearish continuation pattern, with technicals signaling further declines. Bitcoin Price Key Highlights. Bitcoin price recently made a sharp break below a short-term consolidation pattern, which means that sellers have taken control. Price seems to have formed a bearish continuation signal as more sellers could take it down. Technical indicators are also confirming that selling pressure is mounting. Technical Indicators Signals. The 100 SMA is moving below the longer-term 200 SMA, confirming that the path of least resistance is....