Bitcoin Price Technical Analysis for 29/01/2016 – Gathering Bearish Energy?
Bitcoin price recently made a downside break of a short-term symmetrical triangle consolidation pattern, indicating that bears are taking control. Before pushing for more declines, a correction from the breakout move might take place, as sellers are keen on entering at better levels. A descending trend line can be drawn to connect the recent highs of bitcoin price action and the Fibonacci retracement tool suggests potential entry levels. Bitcoin price appears to be making a correction from the recent downside break, providing an opportunity for more bears to enter at higher levels.....
Related News
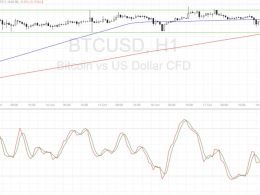
Bitcoin price could continue to consolidate but if a breakout occurs, technicals are favoring a downside move. Bitcoin Price Key Highlights. Bitcoin price is still stuck in its tight range on the short-term time frames, bouncing off support once more. A test of the near-term resistance could be in the cards but technical signals are pointing to a downside break. Buyers seem to be running out of momentum or traders are simply waiting for fresh market catalysts. Technical Indicators Signals. The 100 SMA is above the longer-term 200 SMA for now, which suggests that buyers still may have a bit....
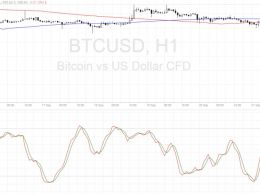
Bitcoin price looks ready continue is dive on a break of this bearish continuation pattern, with technicals signaling further declines. Bitcoin Price Key Highlights. Bitcoin price recently made a sharp break below a short-term consolidation pattern, which means that sellers have taken control. Price seems to have formed a bearish continuation signal as more sellers could take it down. Technical indicators are also confirming that selling pressure is mounting. Technical Indicators Signals. The 100 SMA is moving below the longer-term 200 SMA, confirming that the path of least resistance is....
Key Highlights. Dogecoin price is still stuck in consolidation and is hovering near range support against litecoin. Momentum for a downside range break seems to be building up, as dogecoin price has made lower highs and is pushing closer to the bottom of the range. Dogecoin price has been moving sideways for quite some time around a longer-term area of interest and is revving up for a strong downside breakout. Bears gathering strength. The consolidation is persisting for now, as traders are waiting for more signs of bearish momentum. Short positions are approaching extremes, opening the....
Bitcoin price is still deciding which direction to take, although it is approaching the peak of the triangle and might need to break out soon. The oscillators such as RSI and stochastic are hinting that bearish pressure could come into play, as both indicators are moving lower. Stochastic came out of the overbought zone, indicating that buyers are still taking a break and letting sellers take control. Meanwhile RSI is nearing the overbought region and ready to indicate that buying pressure is fading. On the other hand, the moving averages are showing that buyers might have enough energy....
Ethereum has dropped 1.5 percent to 0.00197BTC, in line with our bearish expectations. We iterated our short view in the previous technical analysis titled Bitcoin-fueled bounce fades away. The price action in the past 24 hours has been strongly bearish and threatens a further 4% drop in the pair. Chart Structure – The underlying weakness in ETH-XBT forced the pair below the 20 4-h SMA (we discussed this possibility in the previous price analysis). The bulls did attempt to reverse the losses but failed miserably as the bears used the breached moving average as an offloading level. The pair....


