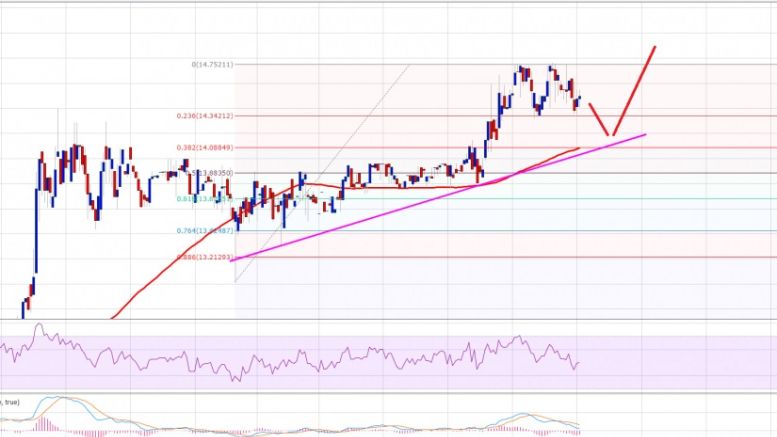
Ethereum Price Technical Analysis – ETH Heading Towards Support
Ethereum price is currently correcting and may continue to move down. However, there is a major support on the downside, which can act as a barrier for sellers. Key Highlights. Ethereum price after trading as high as $14.75 found sellers vs the US dollar, and currently trading down. There is a bullish trend line formed on the hourly chart (data feed via Kraken) of ETH/USD, which can be seen as a support zone if the price moves down. $14.00-10 area holds a lot of importance for the ETH buyers, and may continue to act as a pivot zone. Ethereum Price Trend Line Support. Ethereum price ETH had....
Related News
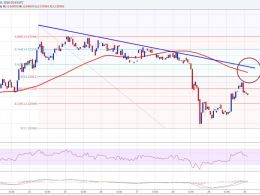
Ethereum price started recovering Intraday against the US Dollar, but it looks like the upside may stall as there is a major resistance around $13.50. Key Highlights. Ethereum price after moving below the $12.00 support area against the US Dollar started recovering. However, the ETH/USD pair is heading towards a major resistance area around the $13.50 level. This week’s highlighted bearish trend line on the hourly chart (data feed via Kraken) of ETH/USD is still intact and may act as a barrier for the buyers. Ethereum Price Resistance. Ethereum price ETH after falling close to the $11.30....

Ethereum Price Key Highlights. Ethereum price retreated from its recent rally upon hitting a high of 0.00294 but might be ready to resume its climb soon. Price has pulled back to the moving averages, which might hold as dynamic support areas, and could gather more bullish momentum. Ethereum price is taking a break from its uptrend but might be due to head north again, if the near-term inflection points hold as support. Correction Over? Technical indicators seem to be suggesting that the ethereum price correction is already over, as stochastic made it out of the oversold region and is....

Ethereum Price Key Highlights. Ethereum price seems to be recovering from its earlier drop, as it is trying to establish a new uptrend visible on its 1-hour time frame. Price is moving slowly inside an ascending channel and is currently testing support. Ethereum price might be able to sustain its short-term climb, with technical indicators and candlestick patterns suggesting a bounce. Bullish Divergence Seen. Stochastic has made a shallow bullish divergence, with price forming lower lows and the oscillator drawing higher lows. This indicator is heading higher, which suggests that ethereum....
DarkNote Price Key Highlights. DarkNote price started a correction phase as anticipated in yesterday's technical analysis. The price is heading towards a major support area at 0.00000078BTC where buyers might appear. Our view of taking profits and to wait for a correction to enter a trade played well. DarkNote price might head further lower from the current levels, but might find support near 0.00000090BTC. Buy Dips? The DarkNote price moved after completing a bullish outside bar candle pattern started a correction phase. We highlighted yesterday that it's better to book profits near....

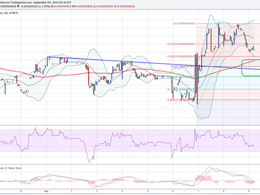
Ethereum Price Key Highlights. Ethereum price has been on a downtrend on its longer-term time frames, but it looks like the tides could turn. A double bottom pattern is visible on the 4-hour chart and price is making its way up to test the neckline at 0.0040. Ethereum price could be in for a long-term uptrend if it is able to break past the neckline resistance soon. Technical Indicators In Favor Of the Bulls. The technical indicators on the 4-hour time frame support further gains in ethereum price, as the 100 SMA just crossed above the 200 SMA. This signals that the path of least....