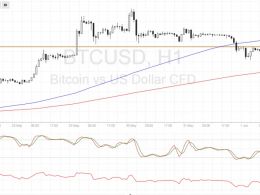
Bitcoin Price Technical Analysis for 08/08/2016 – Bitcoin Bears Waiting…
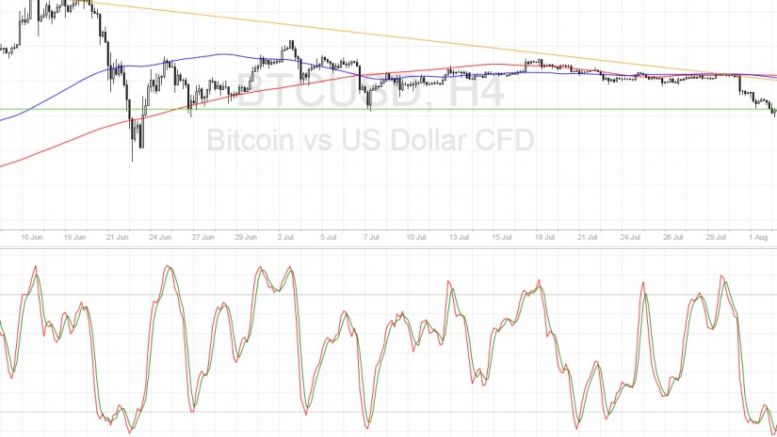
Bitcoin price could be ready to resume its slide after it tests the nearby resistance around $610-620. Bitcoin Price Key Highlights. Bitcoin price is still in the middle of a correction from its recent dive. A descending trend line can be drawn to connect the recent highs of price action on the 4-hour time frame. This trend line coincides with several areas of interest where bears could be waiting with sell orders. Technical Indicators Signals. The 100 SMA is below the 200 SMA on the 4-hour chart so the path of least resistance is still to the downside. In addition, the gap between the....
Related News
Ethereum price traded down finally and also moved back below $10.0. It looks like there is a chance of a minor correction moving ahead. Intraday Support Level can be $9.07. Intraday Resistance Level may be $10.5. Ethereum price as highlighted yesterday made a new high of $11.98 where it found sellers and started to move down. The price also traded below the $10.0 level, which is a sign that bulls stepped back and failed to prevent losses. If the bears manage to gain strength, then there is a chance of more losses in the near term.
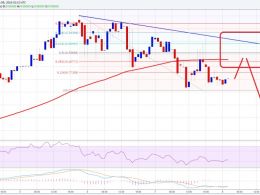
Bitcoin price pulled back from its recent rally and is finding support at a former resistance level. Bitcoin Price Technical Analysis. Bitcoin price is currently testing an area of interest and might be due for a bounce. The broken resistance around $715 is holding as support for the time being. Technical inflection points are also lining up with this area of interest. Technical Indicators Signals. The 100 SMA just crossed above the longer-term 200 SMA so the path of least resistance is to the upside. In addition these moving averages coincide with the former resistance around $715, adding....
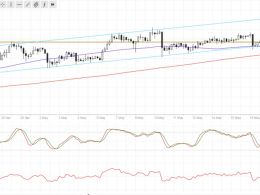
Bitcoin price might be able to break below the channel support if dollar demand picks up in the latter sessions. Bitcoin Price Key Highlights. Bitcoin price is still stuck inside the ascending channel pattern on the 4-hour time frame and still hovering around support. Price has been consolidating above the $450 level for quite some time, as bears are trying to find more energy for a downside break. The FOMC minutes failed to spur dollar demand strong enough for a downside break, leaving bitcoin traders waiting for the next big catalyst. Technical Indicators Signals. The 100 SMA is still....

Weekend Bitcoin trading pulled price below $200 for a few hours today. The bears seemed to find renewed energy for a claw down only to run out of steam near $190. CCN presents summary analysis that finds technical clues of an advance to $260. This analysis is provided by xbt.social with a 3 hour delay. Read the full analysis here. Bitcoin Trading and Price Analysis. Time of analysis: 13h30 UTC. Bitfinex 1-Hour Chart. There is little change in the chart and analysis since yesterday's chart that showed a Fib fan that has provided support to the recent decline. The fan is omitted in favor of....
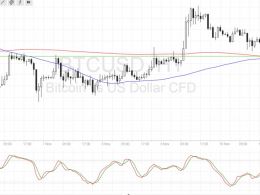
Bitcoin price appears to be correcting from its recent selloff but technical indicators are signaling that a longer-term bounce might be in order. Bitcoin Price Key Highlights. Bitcoin price is pulling up from its recent slide but could be in for more gains if sellers hop in the short-term area of interest. Support at $555 was previously broken and might hold as resistance moving forward. Technical indicators, however, are suggesting that the climb could continue. Technical Indicators Signals. The 100 SMA is safely above the 200 SMA so the path of least resistance is still to the upside.....