Ethereum Price Technical Analysis – ETH Testing Important Support
Ethereum price after trading higher started a move lower against the US Dollar. Is this a correction or the price made a top? Key Highlights. ETH price after surging above the $12.00 handle against the US Dollar found sellers and moved down. There is a minor bullish trend line formed on the hourly chart (data feed via SimpleFX) of ETH/USD, which is currently acting as a support. The pair may either bounce or break the trend line for further declines. Ethereum Price Correction. Ethereum price has enjoyed a decent upside ride against the US Dollar recently to trade as high as $12.12.....
Related News
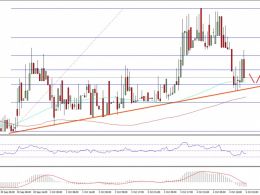
Ethereum price is currently correcting and may continue to move down. However, there is a major support on the downside, which can act as a barrier for sellers. Key Highlights. Ethereum price after trading as high as $14.75 found sellers vs the US dollar, and currently trading down. There is a bullish trend line formed on the hourly chart (data feed via Kraken) of ETH/USD, which can be seen as a support zone if the price moves down. $14.00-10 area holds a lot of importance for the ETH buyers, and may continue to act as a pivot zone. Ethereum Price Trend Line Support. Ethereum price ETH had....

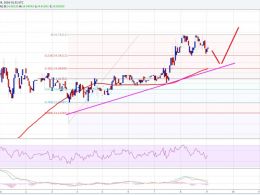
Coming out of weeks of downtrend, the Ethereum price could be looking to establish the next bottom as it sets up for a campaign toward new all-time highs. This is highlighted by crypto analyst MMBTtrader, who explained that the Ethereum price crash could be coming to an end. This is evidenced by a number of formations on the Ethereum price chart that suggest where the next lift-off might begin. Ethereum Price Is Testing The Next Major Support In an analysis shared on the TradingView website, the crypto analyst explained that the Ethereum price is now testing the next crucial technical....

Ethereum Price Key Highlights. Ethereum price seems to be recovering from its earlier drop, as it is trying to establish a new uptrend visible on its 1-hour time frame. Price is moving slowly inside an ascending channel and is currently testing support. Ethereum price might be able to sustain its short-term climb, with technical indicators and candlestick patterns suggesting a bounce. Bullish Divergence Seen. Stochastic has made a shallow bullish divergence, with price forming lower lows and the oscillator drawing higher lows. This indicator is heading higher, which suggests that ethereum....
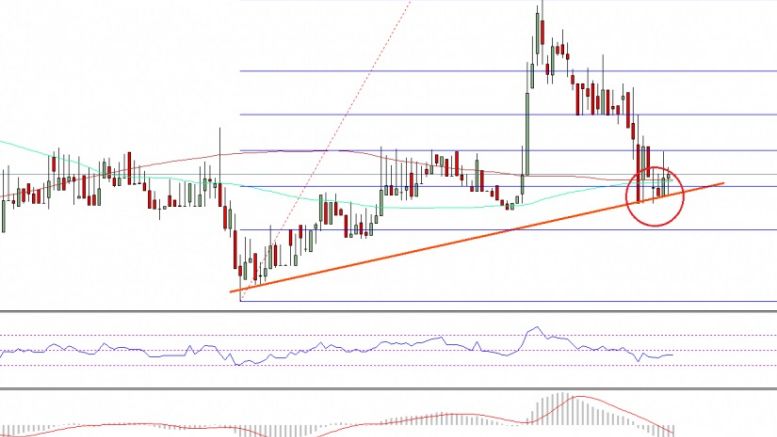
Ethereum price is currently under a correction mode and testing a support area versus the US Dollar. Can ETH/USD bounce sooner or later? Key Highlights. ETH price after trading as high as $13.34 versus the US Dollar traded lower and currently testing a crucial support. There is a major bullish trend line formed on the hourly chart (data feed via SimpleFX) of ETH/USD, which is currently acting as a support. The 100 hourly simple moving average is also currently providing support and protecting further declines. Ethereum Price Correction. Ethereum price yesterday spiked higher against the US....
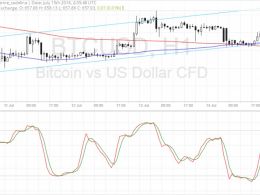
Bitcoin price is testing the ascending channel on the 1-hour time frame, still deciding whether to go for a continuation or a reversal. Bitcoin Price Key Highlights. Bitcoin price has been edging lower recently but the overall uptrend on the short-term chart seems intact. Price is still inside its ascending channel and is currently testing the support. A bounce could confirm that bulls are still in control of bitcoin price action while a breakdown would suggest that a downtrend is in order. Technical Indicators Signals. The 100 SMA is above the 200 SMA, which means that the the path of....