Ethereum Price Technical Analysis – ETH/USD Struggling Near $12.10
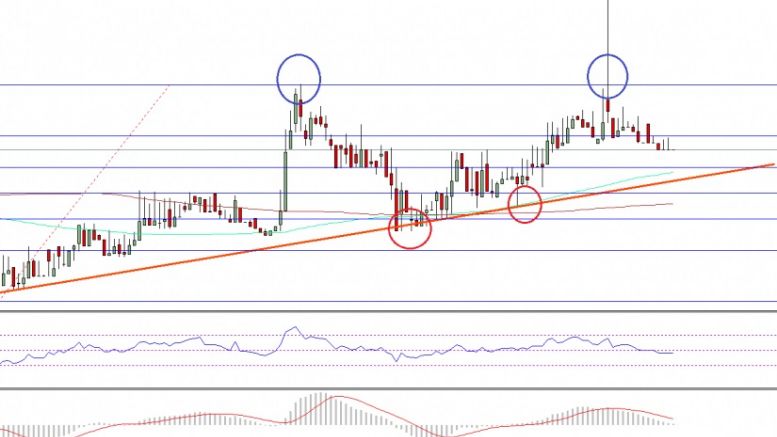
Ethereum price jumped higher once again versus the US Dollar, but the $12.10 level managed to prevent the upside move in ETH/USD. Key Highlights. ETH price attempted another upside move as forecasted against the US Dollar, but failed to break the $12.10 resistance. The main highlighted bullish trend line on the hourly chart (data feed via SimpleFX) of ETH/USD is still in place on the downside acting as a support. There is a chance of a minor dip in the price if it continues to find sellers on the upside. Ethereum Price Resistance. Ethereum price managed to spike another time recently....
Related News

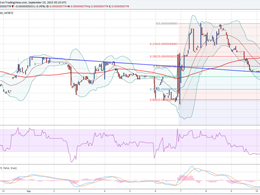
The Christmas isn’t turning out to be merry for Bitcoin. The cryptocurrency is struggling near the overhead resistance of $465. It is now trading 1.28% lower at $450.89, raising concerns that the market participants might pull out their funds in the holiday season. As a result, several technical indicators are also showing declines. We advised in the previous Bitcoin price technical analysis Target Achieved that traders should book at least partial profits in their long positions. And for today’s analysis, we will again be using the 4-h BTC-USD price chart from BITSTAMP.
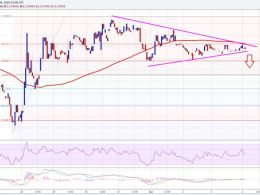
Ethereum price is struggling to trade higher, and approaching a short-term breakout. Can sellers succeed or the bulls will overcome selling pressure? Ethereum price after failing to break the $12.12 level against the US Dollar moved down, and showed a lot of bearish signs lately. The price closed below the 100 hourly simple moving average as well, which suggests that the bulls are struggling to take the price higher. There is a contracting triangle pattern forming on the hourly chart (data feed via Kraken) of ETH/USD, which may be seen as a catalyst for the next move. The highlighted....

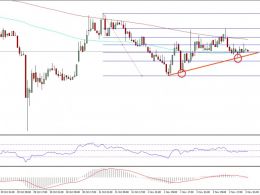
Etheruem Price Key Highlights. Ethereum price is struggling to clear a major resistance area around 0.00390BTC-0.0040BTC. There is a bearish trend line formed on the hourly chart, which is acting as a hurdle for buyers. The price is struggling to settle above the 100 hourly simple moving average, which is a negative sign. Ethereum price is under a bearish pressure, as buyers failed on many occasions to break a major resistance trend line. Can it be broken? The Ethereum price was seen struggling many times to break a crucial bearish trend line formed on the hourly chart. There were at least....
Ethereum price started a downside move once again after failing to close above $11.00. Can ETH/USD continue heading lower? Key Highlights. ETH price corrected higher towards $11.10 against the US Dollar, but failed to retest the last high of $11.35. It looks like the ETH/USD pair created a higher low, which is a signal of the price struggling in the short term. There is a minor bullish trend line formed on the hourly chart (data feed via SimpleFX) of ETH/USD, which must hold if the buyers want to stay in action. Ethereum Price Trend Line Support. ETH price started another wave higher....
DarkNote Price Key Highlights. DarkNote price tested a buy zone, which we highlighted in yesterday's technical analysis. The price is struggling to hold ground as sellers remained in control, creating a risk of a break below 0.00000078BTC. The price has moved below the 100 hourly simple moving average, which is warning sign in the short term. DarkNote price looks like at a risk of more losses, but as long as it is above the broken trend line there is a hope. Risk of More Downsides? The DarkNote price continued to move down after testing a major swing area of 0.00000090BTC and completing a....