Ethereum Price Technical Analysis – ETH/USD Looks To Correct Lower
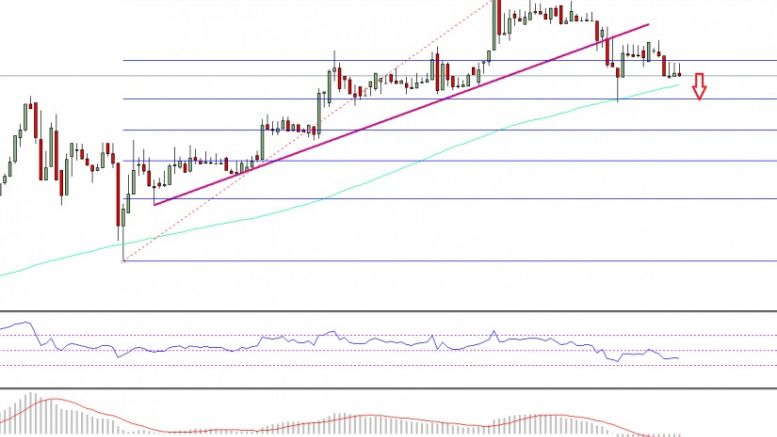
Ethereum price after trading towards $10.85 against the US Dollar started a correction, and ETH/USD may now look for a move towards $10.40-10.30. Key Highlights. ETH price after trading as high as $10.84 against the US Dollar found sellers and started a correction. There was a bullish trend line formed on the hourly chart (data feed via SimpleFX) of ETH/USD, which was cleared during the downside move at $10.70. The pair is currently correcting lower, and looks poised for an extension. Ethereum Price Downside Move. We saw a nice and solid upside move in ETH price against the US Dollar. It....
Related News
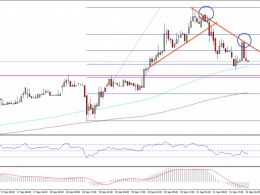
Ethereum price after making a new high versus the US Dollar created a top and started moving lower. More losses to follow? Key Highlights. ETH price after setting a high against the US Dollar moved down and traded below the $13.60 level. Yesterday’s highlighted bullish trend line on the hourly chart (data feed via SimpleFX) of ETH/USD was broken to open the doors for more losses. My suggestion to stay alert yesterday was correct, as the price corrected lower sharply. Ethereum Price Correction. Ethereum price recently posted a high of $14.25 against the US Dollar where sellers appeared and....
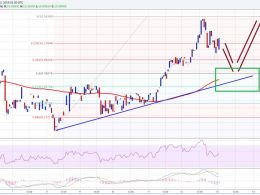
Ethereum price traded further higher yesterday, and reached my final target of $10.40. Now can it correct and trade higher once again? Key Highlights. Ethereum price continued to move higher vs the US Dollar and reached my final target of $10.40. There is now a bullish trend line formed on the hourly chart (data feed via Kraken) of ETH/USD, which may act as a support if the price moves down. The price has already started correcting lower, and it would be interesting to see how far it can go. Ethereum Price Trend Line Support. Ethereum price ETH after settling above the $10.00 resistance....
Key Highlights. Ethereum price found resistance around the bearish trend line as highlighted in yesterday's post. There was a downside reaction, which took the price further lower to create a new low of 0.00242BTC. More losses are possible moving ahead, as there is a lot of bearish pressure at the moment. Ethereum price remains at risk of a break lower, as it moved below 0.00250BTC and looks poised for more losses. New Low? The Ethereum price made an attempt to correct higher, but it found sellers on the upside. An immediate resistance around the 23.6% Fib retracement level of the last....
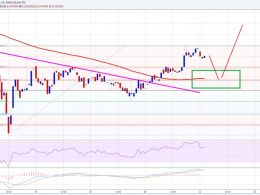
Ethereum price moved above a major resistance area intraday. Buying dips may be a good option in the short term as long as it is above $10.50. Intraday Support Level can be $10.50. Intraday Resistance Level may be $12.00. Yesterday, I stated that if Ethereum price manages to close above the 100 simple moving average (hourly, data feed via Kraken), then we can consider a buy trade. The idea worked perfectly, as there was a break and close above the stated MA and there was a nice upside move. The price traded as high as $12.00, where it found sellers and moving ahead may correct a few points....
Ethereum is trading very flat in a dull session as bitcoin remains undecided about the future direction. Currently at 0.00191BTC, Ethereum is in a no trade zone as discussed in the previous technical analysis. Sole Positive – The technical indicators are, however, rebounding from the respective oversold levels. I would like to discuss the resistance and support levels for Ethereum now. To serve this purpose, I will be using the 4-h ETH-XBT pair. Chart Structure – The pair has been registering lower tops and lower bottoms for the past 10 trading sessions. Connecting the two highs in this....


